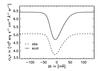
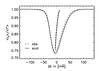
Fig. 6
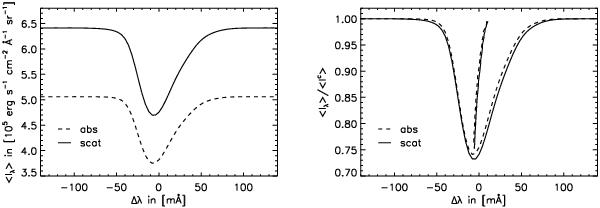
Spatial averages of disk center intensity profiles (left panel) and normalized disk center intensity profiles with bisectors (right panel) of a fictitious low-excitation (χ = 0 eV) Fe i line plotted as functions of wavelength shift Δλ in mÅ with λ0 = 3000 Å, computed for an arbitrary snapshot of the 3D model with [Fe/H] = −3.0 including coherent continuum scattering (solid lines) and treating scattering as absorption (dashed lines).
Current usage metrics show cumulative count of Article Views (full-text article views including HTML views, PDF and ePub downloads, according to the available data) and Abstracts Views on Vision4Press platform.
Data correspond to usage on the plateform after 2015. The current usage metrics is available 48-96 hours after online publication and is updated daily on week days.
Initial download of the metrics may take a while.