Fig. 5
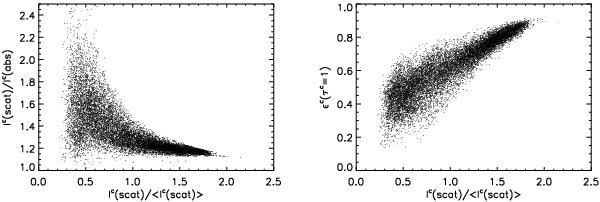
Left: correlation between the continuum intensity ratio Ic(scat)/Ic(abs) and the normalized continuum intensities with scattering Ic(scat)/⟨Ic(scat)⟩ at 3000 Å, computed for an arbitrary snapshot of the 3D model with [Fe/H] = −3.0. Right: correlation between the continuum photon destruction probabilities ϵc at the local monochromatic continuum optical surface τc = 1 and the normalized continuum intensities with scattering Ic(scat)/⟨Ic(scat)⟩ at 3000 Å for the same model.
Current usage metrics show cumulative count of Article Views (full-text article views including HTML views, PDF and ePub downloads, according to the available data) and Abstracts Views on Vision4Press platform.
Data correspond to usage on the plateform after 2015. The current usage metrics is available 48-96 hours after online publication and is updated daily on week days.
Initial download of the metrics may take a while.