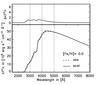
Fig. 2
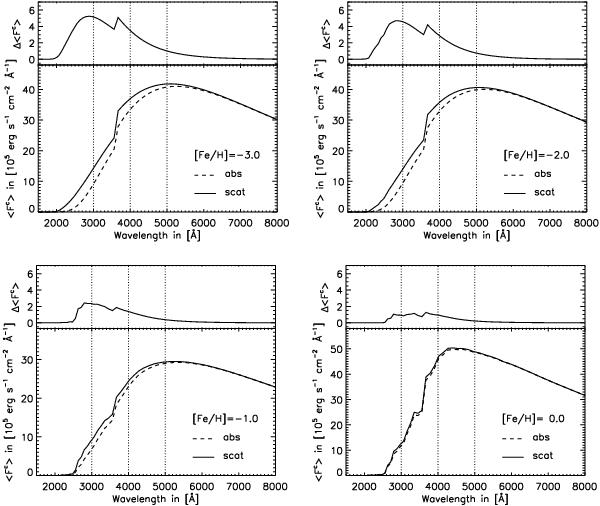
Spatial and temporal averages of the continuum flux distribution ⟨Fc⟩ as a function of wavelength, computed for time sequences of the 3D model atmospheres with metallicity −3.0 ≤ [Fe/H] ≤ 0.0 (upper left to lower right), treating scattering as absorption (dashed lines) and as coherent scattering (solid lines). The upper panel of each plot shows the deviation Δ⟨Fc⟩ of the coherent scattering cases from the continuum flux distribution where scattering is treated as absorption; vertical dotted lines indicate λ = 3000 Å, 4000 Å and 5000 Å where Fe line profiles were computed. Note the Balmer jump at 3647 Å.
Current usage metrics show cumulative count of Article Views (full-text article views including HTML views, PDF and ePub downloads, according to the available data) and Abstracts Views on Vision4Press platform.
Data correspond to usage on the plateform after 2015. The current usage metrics is available 48-96 hours after online publication and is updated daily on week days.
Initial download of the metrics may take a while.