Fig. 17
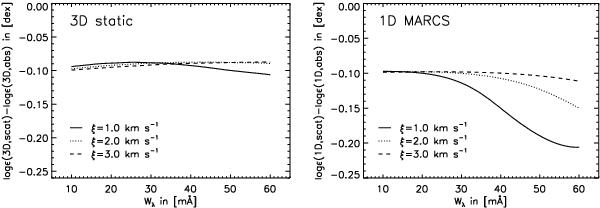
Abundance corrections for the same Fe i line as shown in Fig. 9, but computed for the 3D model with [Fe/H] = −3.0 and with velocity fields set to zero (left panel) and for the corresponding 1D hydrostatic MARCS model with [Fe/H] = −3.0 (right panel), assuming microturbulent broadening with ξ = 1.0 km s-1 (solid lines), ξ = 2.0 km s-1 (dotted lines), and ξ = 3.0 km s-1 (dashed lines).
Current usage metrics show cumulative count of Article Views (full-text article views including HTML views, PDF and ePub downloads, according to the available data) and Abstracts Views on Vision4Press platform.
Data correspond to usage on the plateform after 2015. The current usage metrics is available 48-96 hours after online publication and is updated daily on week days.
Initial download of the metrics may take a while.