Fig. 16
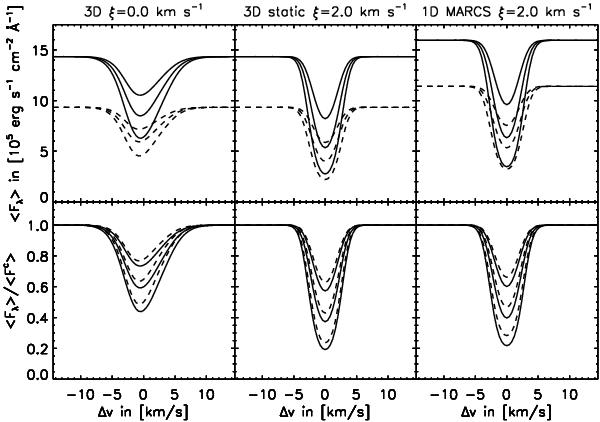
Spatial averages of flux profiles as functions of Doppler shift Δv from the line center for the Fe i line of Fig. 9, computed treating scattering as absorption (dashed lines) and as coherent scattering (solid lines) using the 3D model with [Fe/H] = −3.0 (left column), the 3D model with [Fe/H] = −3.0 and with velocity fields set to zero (3D static model, center column) and the 1D hydrostatic MARCS model with [Fe/H] = −3.0 (right column). The bottom row shows normalized profiles. The 3D static model and the 1D model assume microturbulent broadening with ξ = 2.0 km s-1; line strengths of the 1D calculations needed to be increased by +0.7 dex to obtain similar equivalent widths (see text).
Current usage metrics show cumulative count of Article Views (full-text article views including HTML views, PDF and ePub downloads, according to the available data) and Abstracts Views on Vision4Press platform.
Data correspond to usage on the plateform after 2015. The current usage metrics is available 48-96 hours after online publication and is updated daily on week days.
Initial download of the metrics may take a while.