Fig. 10
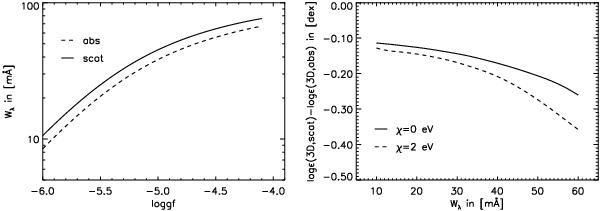
Left: curves of growth for the Fe i line of Fig. 9 (3D model with [Fe/H] = −3.0) as a function of oscillator strength log gf, computed with scattering as absorption (dashed line) and as coherent scattering (solid line). Right: corresponding 3D−3D scattering abundance corrections as a function of equivalent width Wλ for the curves of growth shown in the left panel where χ = 0 eV (solid line), and for a Fe i line with χ = 2 eV (dashed line).
Current usage metrics show cumulative count of Article Views (full-text article views including HTML views, PDF and ePub downloads, according to the available data) and Abstracts Views on Vision4Press platform.
Data correspond to usage on the plateform after 2015. The current usage metrics is available 48-96 hours after online publication and is updated daily on week days.
Initial download of the metrics may take a while.