Free Access
Fig. 6
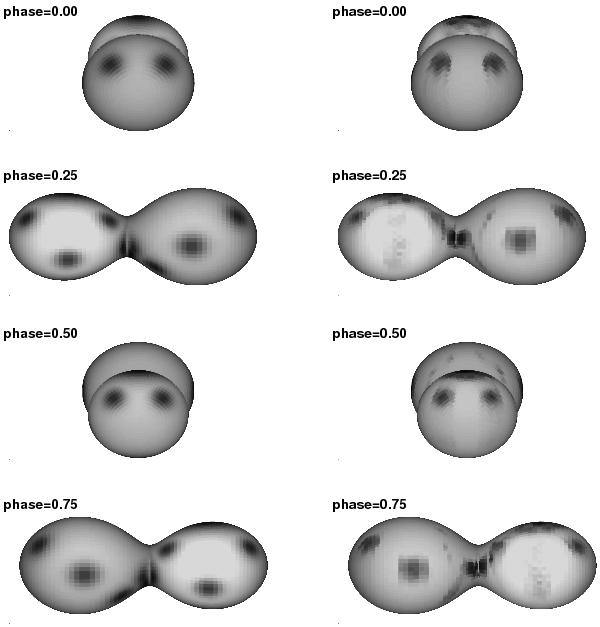
The left panel shows the input spot model for the test. Black represents the position of dark cool spots. The right panel belongs to the reconstructed images based on the input spot model and a phase coverage similar to our combined August 10 and 13 dataset.
Current usage metrics show cumulative count of Article Views (full-text article views including HTML views, PDF and ePub downloads, according to the available data) and Abstracts Views on Vision4Press platform.
Data correspond to usage on the plateform after 2015. The current usage metrics is available 48-96 hours after online publication and is updated daily on week days.
Initial download of the metrics may take a while.