Fig. 4
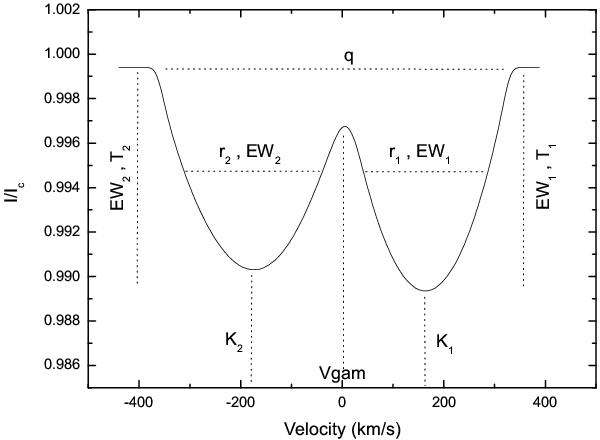
This diagram shows how basic system parameters affect fits to the observed data. The center-of-mass velocity, Vgam, controls the radial velocity offset of the line profiles. The K1 and K2 velocities determine the maximum relative separation of the line profile contributions from both components. The radii of both components, r1 and r2, with the line EW determine the fit to the width and strength of the line profiles, while the mass ratio, q, determines the overall width depending on the K1 and K2 velocities. The surface temperatures of both components, T1 and T2, with the line EW parameter control the the strength of the line profiles.
Current usage metrics show cumulative count of Article Views (full-text article views including HTML views, PDF and ePub downloads, according to the available data) and Abstracts Views on Vision4Press platform.
Data correspond to usage on the plateform after 2015. The current usage metrics is available 48-96 hours after online publication and is updated daily on week days.
Initial download of the metrics may take a while.