Fig. 10
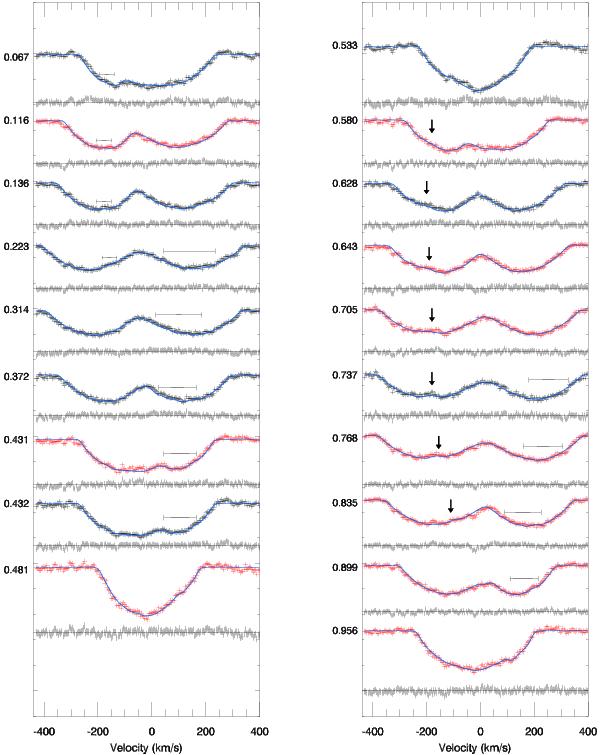
Phase-ordered LSD profiles of August 10 (black) and 13 (red) data. Phases are shown on the left side of each profile. Solid blue lines represent the maximum entropy regularized models obtained using DoTS. The black vertical lines show residuals from the modelling of combined datasets, which also represent the uncertainties in each profile. Arrows and bars show the modelled spot features, which will be discussed in text, in detail.
Current usage metrics show cumulative count of Article Views (full-text article views including HTML views, PDF and ePub downloads, according to the available data) and Abstracts Views on Vision4Press platform.
Data correspond to usage on the plateform after 2015. The current usage metrics is available 48-96 hours after online publication and is updated daily on week days.
Initial download of the metrics may take a while.