Fig. 1
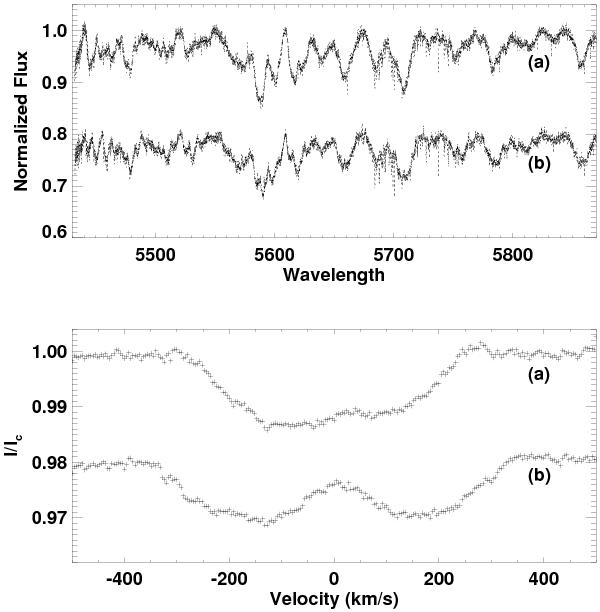
The top panel shows the input spectra from August 10 a) and August 13 b) that correspond to the phases 0.43 and 0.64, with the input S/N values of 99.3 and 102.1, respectively. The lower panel shows the LSD profile correspondence of the related spectrum with the deconvolved S/N values 935 and 943. A part of the wavelength region is plotted in order to more clearly represent the quality of observations.
Current usage metrics show cumulative count of Article Views (full-text article views including HTML views, PDF and ePub downloads, according to the available data) and Abstracts Views on Vision4Press platform.
Data correspond to usage on the plateform after 2015. The current usage metrics is available 48-96 hours after online publication and is updated daily on week days.
Initial download of the metrics may take a while.