Free Access
Fig. 8
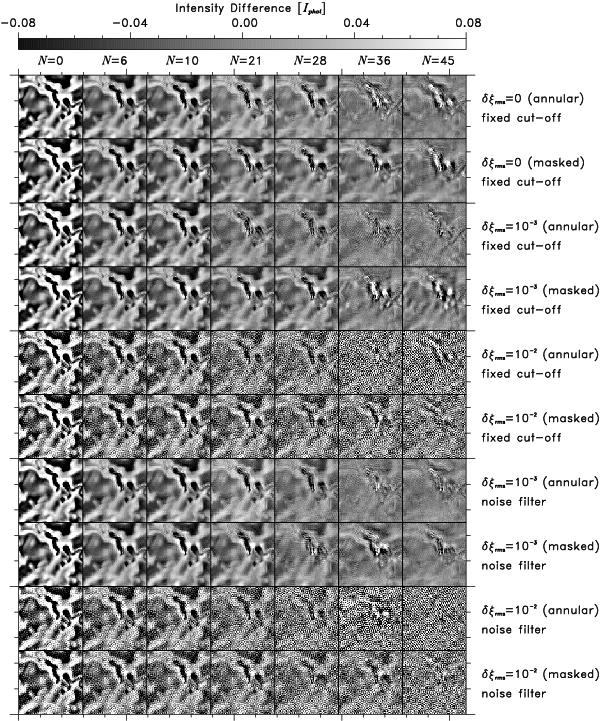
Intensity difference of details (white square in Fig. 2) of the original and the reconstructed MHD images applying different noise levels and numbers of fitted polynomials. Each image was normalised to its mean intensity, Iphot, before building the difference. Tickmarks are given in arcseconds.
Current usage metrics show cumulative count of Article Views (full-text article views including HTML views, PDF and ePub downloads, according to the available data) and Abstracts Views on Vision4Press platform.
Data correspond to usage on the plateform after 2015. The current usage metrics is available 48-96 hours after online publication and is updated daily on week days.
Initial download of the metrics may take a while.