Fig. 7
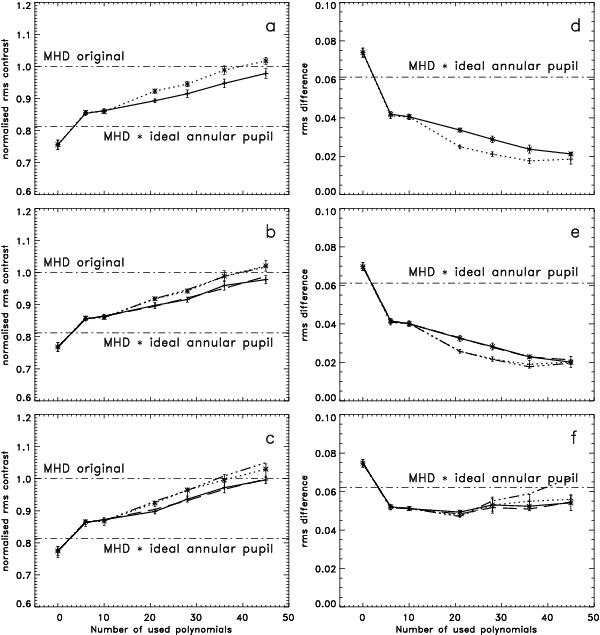
Averaged normalised rms contrasts of PD reconstructions of 10 MHD snapshots degraded with the wavefront errors shown in Fig. 1c. The noise levels were set to zero (panel a)), 10-3 (panel b)) and 10-2 (panel c)). Solid lines correspond to masked-pupil reconstructions, dotted lines denote annular-pupil reconstructions. The dashed and the dash-dot-dot-dotted line in panels (b)) and (c)) were obtained from applying an optimum noise filter instead of a fixed cut-off and masked and annular pupils, respectively. d)–f) Same as a)–c) but for mean contrasts of the difference images (IMHD − IPD)/IMHD. The dash-dotted curves show the normalised contrast of the original MHD image and the contrast after convolution with the PSF of an ideal annular telescope, averaged over the 10 MHD snapshots.
Current usage metrics show cumulative count of Article Views (full-text article views including HTML views, PDF and ePub downloads, according to the available data) and Abstracts Views on Vision4Press platform.
Data correspond to usage on the plateform after 2015. The current usage metrics is available 48-96 hours after online publication and is updated daily on week days.
Initial download of the metrics may take a while.