Fig. 5
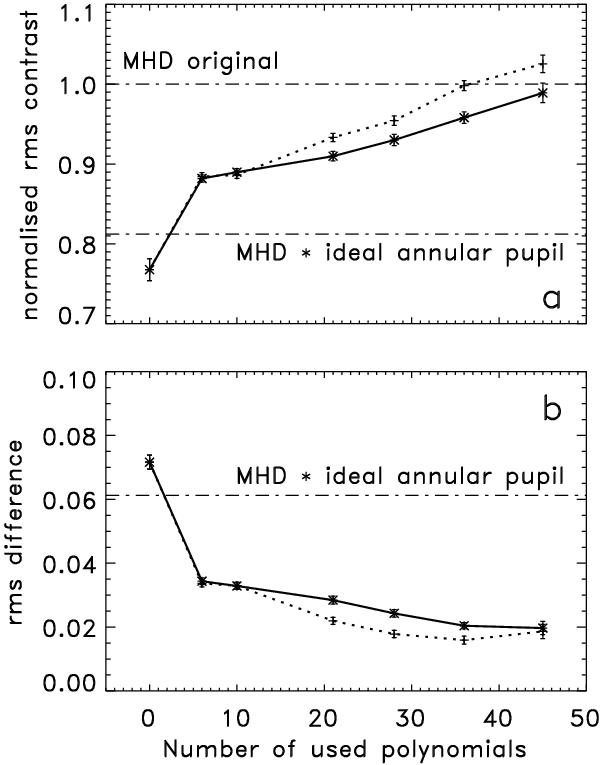
a) Mean rms intensity contrasts, obtained from MHD images which are artificially degraded with the wavefront errors produced by the main mirror of Sunrise (cf. Fig. 1b) and subsequently PD reconstructed. rms values are normalised to that of the original MHD images. Error bars denote the corresponding standard deviations obtained from applying the procedure to 10 different snapshots. The solid curves were obtained using a masked pupil and the dotted curves stem from using an annular pupil. The contrast of the images corrected only for diffraction at the entrance pupil is given by the leftmost data point (zero fit coefficients). b) Mean contrasts of the difference images (IMHD − IPD)/IMHD. The dash-dotted curves show the normalised contrast of the original MHD image and the contrast after convolution with the PSF of an ideal annular telescope, averaged over the 10 MHD snapshots.
Current usage metrics show cumulative count of Article Views (full-text article views including HTML views, PDF and ePub downloads, according to the available data) and Abstracts Views on Vision4Press platform.
Data correspond to usage on the plateform after 2015. The current usage metrics is available 48-96 hours after online publication and is updated daily on week days.
Initial download of the metrics may take a while.