Fig. 3
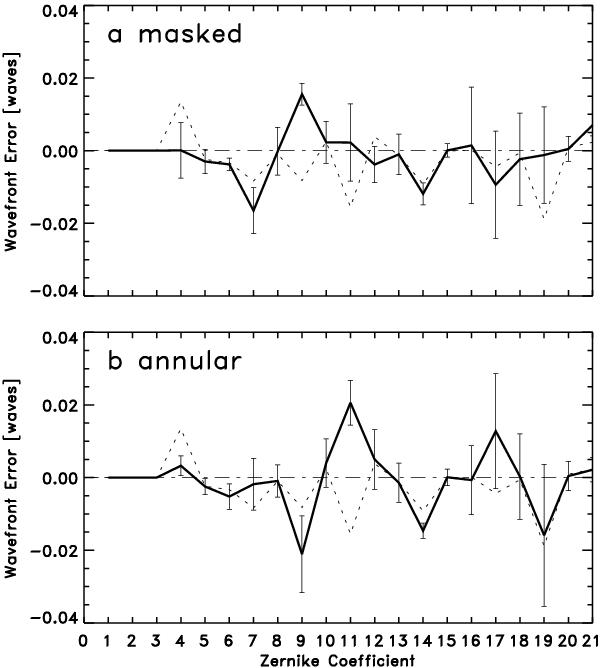
Reconstructed wavefront errors of 10 MHD images degraded with the wavefront errors produced by the main mirror of Sunrise only. The figure shows the coefficients of original Zernike polynomials averaged over 10 MHD snapshots, each subdivided into nine sub-boxes, and the corresponding standard deviations. The dotted curves show a decomposition of the true wavefront into Zernike polynomials.
Current usage metrics show cumulative count of Article Views (full-text article views including HTML views, PDF and ePub downloads, according to the available data) and Abstracts Views on Vision4Press platform.
Data correspond to usage on the plateform after 2015. The current usage metrics is available 48-96 hours after online publication and is updated daily on week days.
Initial download of the metrics may take a while.