Fig. 2
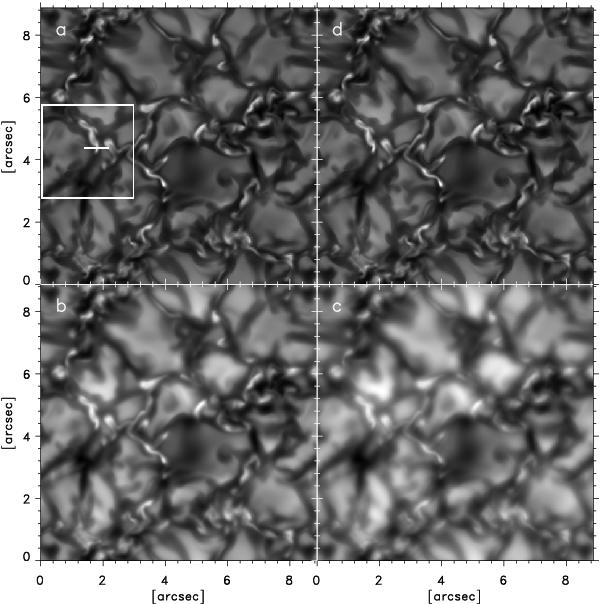
a) Artificial solar image in the 388 nm band as obtained from MHD simulations and non-grey radiative transport calculations after remapping to the SuFI plate scale; b) MHD image degraded by convolving with the wavefront errors displayed in Fig. 1c and by adding a noise level of 10-3; c) MHD image degraded with an additional defocus of 0.58 waves; d) PD reconstruction of panels b) and c) for N = 21 and applying a masked pupil. The bold white line around position  in panel a) denotes a cut through a bright point discussed in Sect. 4.1 and Fig. 6. The white square marks the detail shown in Fig. 8.
Current usage metrics show cumulative count of Article Views (full-text article views including HTML views, PDF and ePub downloads, according to the available data) and Abstracts Views on Vision4Press platform.
Data correspond to usage on the plateform after 2015. The current usage metrics is available 48-96 hours after online publication and is updated daily on week days.
Initial download of the metrics may take a while.