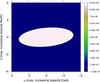
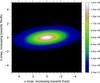
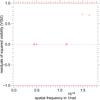
Fig. 4
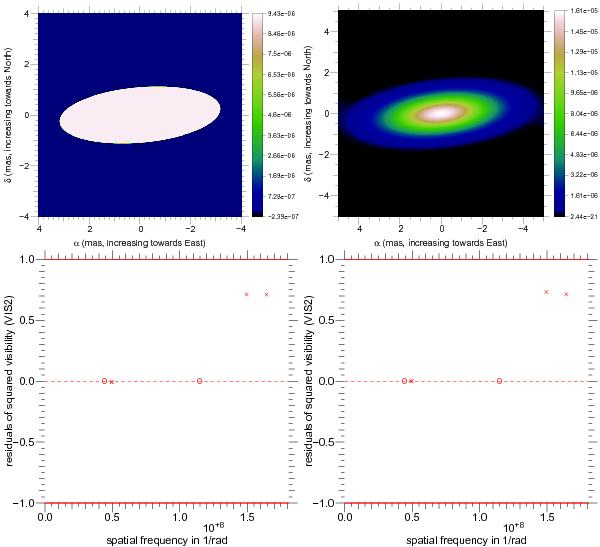
Best model for ψ Per disk obtained with the LITpro software in the Hα line. On top, uniform (left) and Gaussian (right) 2D map of the disk projected onto the skyplane. East is to the left. On bottom, residual visibilities for ψ Per for the uniform disk model (left) and the Gaussian disk model (right) in the Hα line. Y axes are given in standard deviation σ.

Current usage metrics show cumulative count of Article Views (full-text article views including HTML views, PDF and ePub downloads, according to the available data) and Abstracts Views on Vision4Press platform.
Data correspond to usage on the plateform after 2015. The current usage metrics is available 48-96 hours after online publication and is updated daily on week days.
Initial download of the metrics may take a while.