Fig. 3
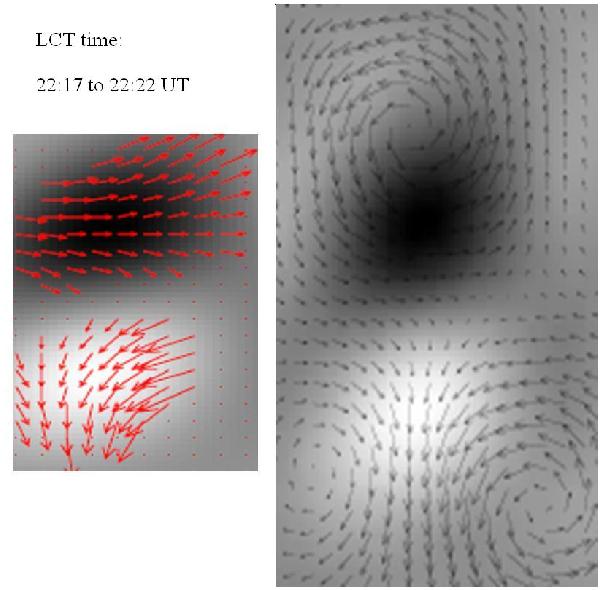
Horizontal plasma velocities in the photosphere. Left panel: velocities obtained by applying LCT technique to MDI magnetograms between 22:17 and 22:22 UT. The right panel shows the vortices that are used to approximate this motion in the simulation. The panels are showing the region that covers the two main magnetic flux concentrations with approximately 3.6 Mm width and 10.87 Mm height.
Current usage metrics show cumulative count of Article Views (full-text article views including HTML views, PDF and ePub downloads, according to the available data) and Abstracts Views on Vision4Press platform.
Data correspond to usage on the plateform after 2015. The current usage metrics is available 48-96 hours after online publication and is updated daily on week days.
Initial download of the metrics may take a while.