Fig. 2
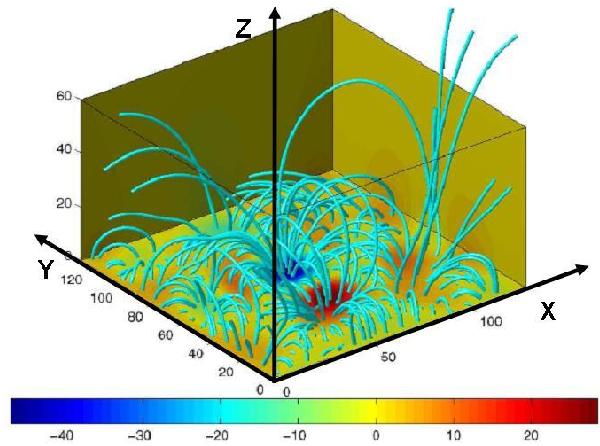
Potential magnetic field extrapolated from the filtered MDI magnetograms and used as initial configuration for the magnetic field in our simulation. The blue lines show the magnetic field lines. The color code depicts the LOS component of the magnetic field. Note that axes here are in terms of grid points, 64 in z direction and 128 × 128 in x, y plane. This corresponds to 15.45 Mm at z direction and 46.4 Mm at x and y directions.
Current usage metrics show cumulative count of Article Views (full-text article views including HTML views, PDF and ePub downloads, according to the available data) and Abstracts Views on Vision4Press platform.
Data correspond to usage on the plateform after 2015. The current usage metrics is available 48-96 hours after online publication and is updated daily on week days.
Initial download of the metrics may take a while.