Fig. 11
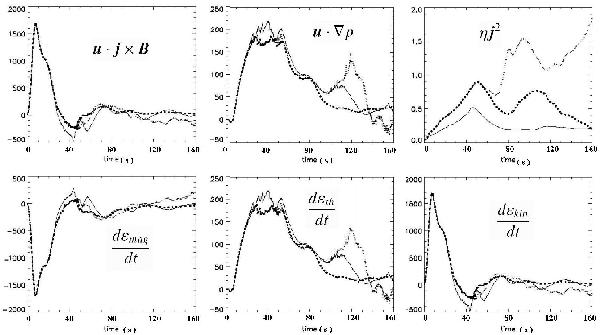
Top panels show the work done by the Lorentz force, the pressure gradient force, and the Joule heating power. The energy change rates for three different resistivity models are shown in the bottom panels. Different lines correspond to anomalous current carrier-dependent (dashed), anomalous current-dependent (dotted) and constant (solid line) resistivity models. Note that the values are measured in units of power,  W.
W.
Current usage metrics show cumulative count of Article Views (full-text article views including HTML views, PDF and ePub downloads, according to the available data) and Abstracts Views on Vision4Press platform.
Data correspond to usage on the plateform after 2015. The current usage metrics is available 48-96 hours after online publication and is updated daily on week days.
Initial download of the metrics may take a while.