Free Access
Fig. 7
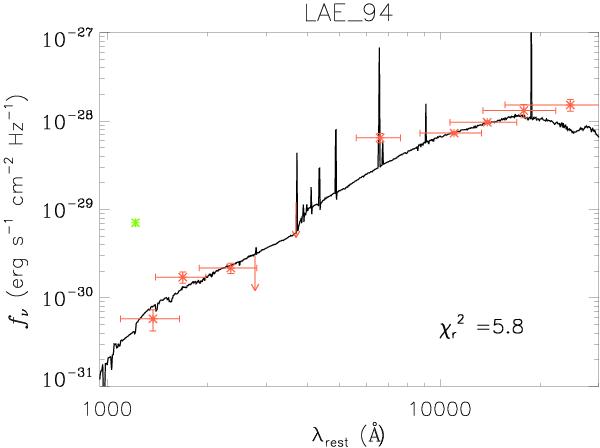
SED of LAE_COSMOS_94. It is very faint in the broad-bands, although with a large Lyα flux, and a very red SED in the Spitzer bands. Red points are observed data-points, arrows mark upper limits. The solid line shows the best fit spectrum. The green data point is the narrow-band flux (Lyα) for reference.
Current usage metrics show cumulative count of Article Views (full-text article views including HTML views, PDF and ePub downloads, according to the available data) and Abstracts Views on Vision4Press platform.
Data correspond to usage on the plateform after 2015. The current usage metrics is available 48-96 hours after online publication and is updated daily on week days.
Initial download of the metrics may take a while.