Fig. 6
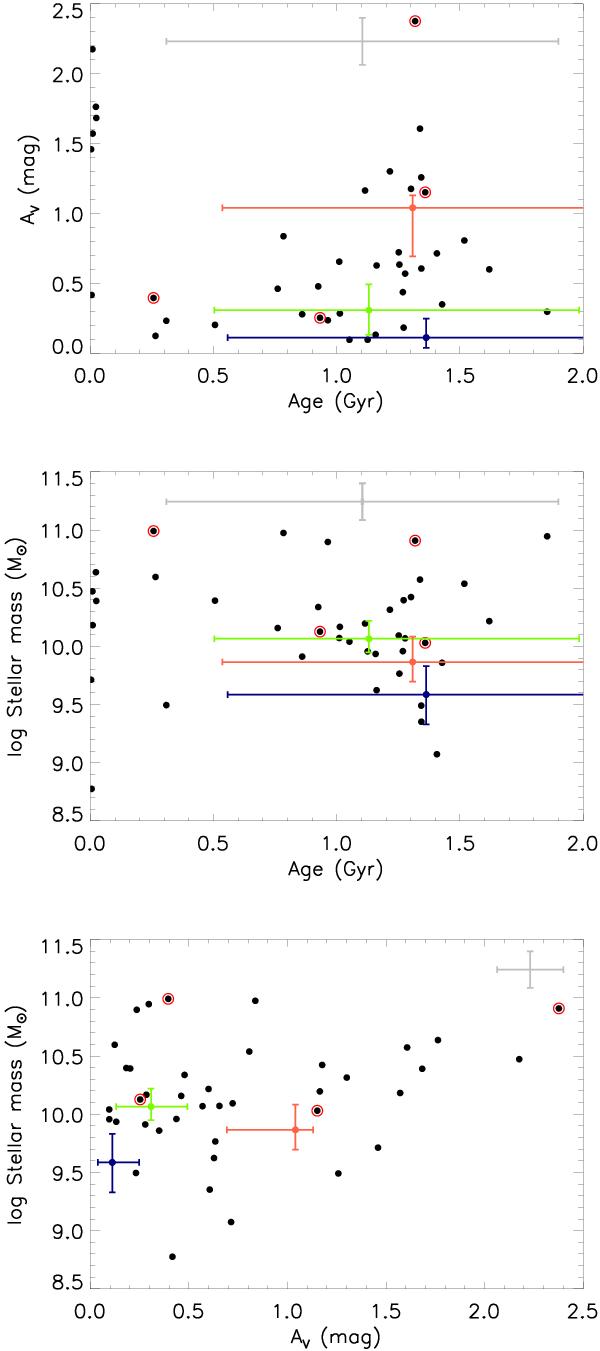
Results of 40 objects with  (black points). The coloured data points represent the stacked SEDs, with green as the total sample, red and blue points are the red and blue sub-samples. Typical error bars are marked in grey. In the two top panels the error bars in the “Age” direction refer to those with ages above 100 Myr. For the single young population objects, the typical error in age is ~ 15 Myr. LAE ULIRGs (from Nilsson & Møller 2009) are marked with a red ring.
Current usage metrics show cumulative count of Article Views (full-text article views including HTML views, PDF and ePub downloads, according to the available data) and Abstracts Views on Vision4Press platform.
Data correspond to usage on the plateform after 2015. The current usage metrics is available 48-96 hours after online publication and is updated daily on week days.
Initial download of the metrics may take a while.