Fig. 1
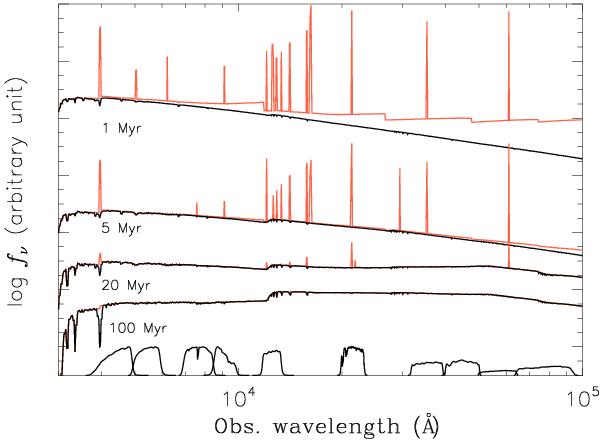
Illustration of the added nebular emission. GALAXEV spectra at z = 2.25 with ages 1, 5, 20, and 100 Myr are shown with nebular emission lines (red) and without (black). The spectra are scaled to arbitrary units to illustrate the effect of age on the nebular emission. The filtercurves of the filters used in the fitting (Bj, Vj, i + , z + , J, Ks and Spitzer Ch1-4) are shown at the bottom of the figure. The nebular emission lines are added as delta functions at the respective wavelength of the emission lines, and the step-like appearance of the 1 Myr spectrum is due to the nebular continuum emission. At ages larger than 20 Myr, the effect of the nebular add-on becomes negligible.
Current usage metrics show cumulative count of Article Views (full-text article views including HTML views, PDF and ePub downloads, according to the available data) and Abstracts Views on Vision4Press platform.
Data correspond to usage on the plateform after 2015. The current usage metrics is available 48-96 hours after online publication and is updated daily on week days.
Initial download of the metrics may take a while.