Fig. 11
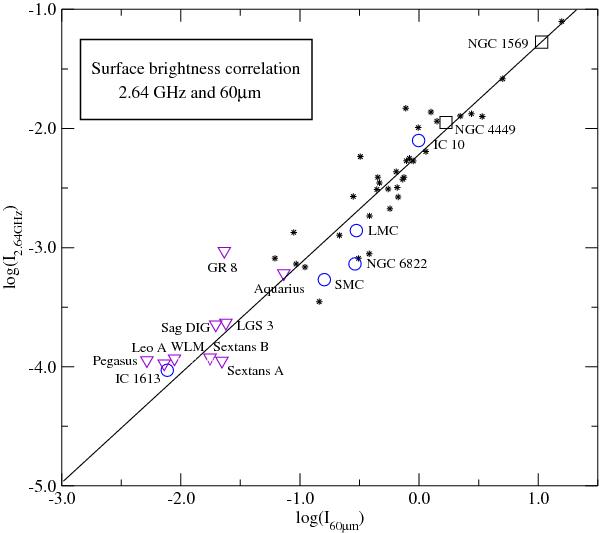
The radio-infrared correlation diagram for LG dwarfs and comparison dwarfs (plotted with the same symbols as in Fig. 7), and for the sake of reference, the sample of galaxies observed by de Jong (1967) plotted as stars. The surface brightness at 2.64 GHz and at 60 μm is used (in Jy/◻′). The solid line is an orthogonal fit to the reference galaxies.
Current usage metrics show cumulative count of Article Views (full-text article views including HTML views, PDF and ePub downloads, according to the available data) and Abstracts Views on Vision4Press platform.
Data correspond to usage on the plateform after 2015. The current usage metrics is available 48-96 hours after online publication and is updated daily on week days.
Initial download of the metrics may take a while.