Fig. 4
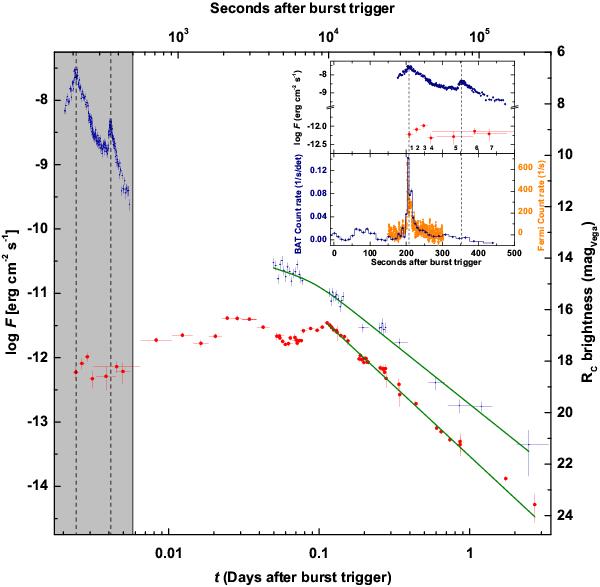
Temporal evolution of the optical (composite light curve with all data shifted to the Rc band) and X-ray afterglow (0.3 to 10 keV) of GRB 080928 (optical: red circles, X-ray: blue error bars). The upper limits are not shown here to avoid confusion. The zoom-in shows the early phase (also highlighted in gray in the big figure) where it is compared with the BAT-GBM prompt emission. The dashed vertical lines indicate the peak times of the two X-ray flares. The curve represents the best fit of the late-time data.
Current usage metrics show cumulative count of Article Views (full-text article views including HTML views, PDF and ePub downloads, according to the available data) and Abstracts Views on Vision4Press platform.
Data correspond to usage on the plateform after 2015. The current usage metrics is available 48-96 hours after online publication and is updated daily on week days.
Initial download of the metrics may take a while.