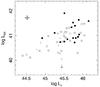
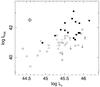
Fig. 7

Plots of X-ray (upper panel: 0.5–2 keV; lower panel: 2–10 keV) versus infrared luminosity. The X-ray luminosity has been corrected only for Galactic absorption. The X-ray selected AGN are marked with filled squares. The typical error bars are indicated. For objects that are not detected, the 95 per cent upper limits are indicated by arrows. When multiple components are resolved in a single system, their luminosities are computed separately (Table 3). The decomposition of the infrared luminosity in individual objects is described in Appendix A. There is a moderate correlation, with a correlation coefficient of ~ 0.6 for both plots.
Current usage metrics show cumulative count of Article Views (full-text article views including HTML views, PDF and ePub downloads, according to the available data) and Abstracts Views on Vision4Press platform.
Data correspond to usage on the plateform after 2015. The current usage metrics is available 48-96 hours after online publication and is updated daily on week days.
Initial download of the metrics may take a while.