Fig. 5
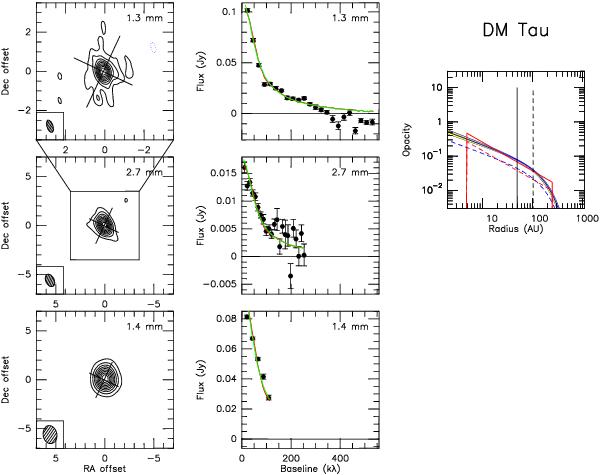
Left row: high angular resolution images of DM Tau. On top, high resolution 1.3 mm image, in the middle, the 2.7 mm (or 3.4 mm for some sources) image with a box indicating the size of the 1.3 mm view. For sources (like this one) that have independent data sets at other wavelengths (1.4 or 3.4 mm), a lower panel displays the corresponding image for the same area as above. All contours are 10% of the peak value to illustrate consistently the apparent sizes and low level extensions. Contour level is 2 mJy/beam (3.5σ) at 1.3 mm, 0.78 mJy/beam (2σ) at 2.7 mm, and 6 mJy/beam (7σ) at 1.4 mm. Middle row: deprojected and circularly averaged visibilities and best-fit models for each wavelength. Red is for power law, green for exponential edge. Right panel: best-fit opacity profile (perpendicular to the disk plane, i.e. κνΣ(r)) for the 1.3 mm and long wavelength models. The continuous line is for the short wavelength, the dashed line for the long wavelength. The vertical lines indicate the effective angular resolution.
Current usage metrics show cumulative count of Article Views (full-text article views including HTML views, PDF and ePub downloads, according to the available data) and Abstracts Views on Vision4Press platform.
Data correspond to usage on the plateform after 2015. The current usage metrics is available 48-96 hours after online publication and is updated daily on week days.
Initial download of the metrics may take a while.