Free Access
Fig. 2
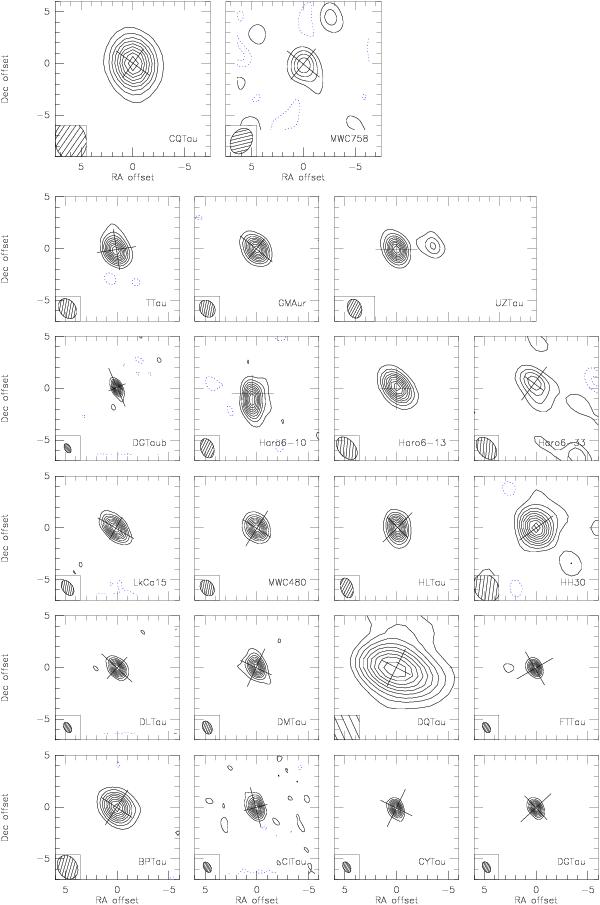
High angular resolution image of the continuum emission from the sources observed in the survey at 2.7 or 3.4 mm. The contours are relative to the peak intensity, in steps of 10%, except for the weakest sources (Haro 6-33 & MWC 758) for which the step is 20%.
Current usage metrics show cumulative count of Article Views (full-text article views including HTML views, PDF and ePub downloads, according to the available data) and Abstracts Views on Vision4Press platform.
Data correspond to usage on the plateform after 2015. The current usage metrics is available 48-96 hours after online publication and is updated daily on week days.
Initial download of the metrics may take a while.