Free Access
Fig. C.1
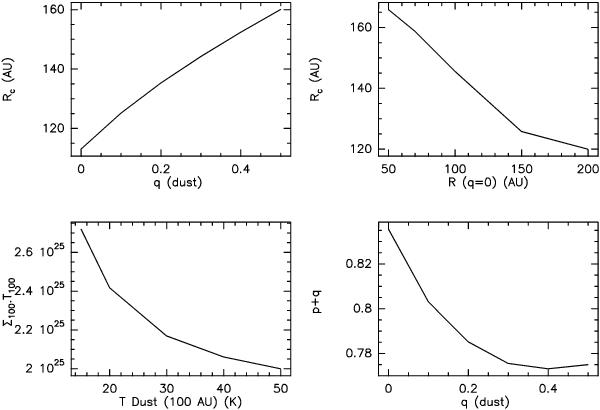
Sample results illustrating the main dependency of the surface density profile on the temperature law. Top left: Rc versus q. Top right: Rc versus Rf; bottom left: Σ.T versus T; bottom right: p + q versus q. The observed source is DL Tau.
Current usage metrics show cumulative count of Article Views (full-text article views including HTML views, PDF and ePub downloads, according to the available data) and Abstracts Views on Vision4Press platform.
Data correspond to usage on the plateform after 2015. The current usage metrics is available 48-96 hours after online publication and is updated daily on week days.
Initial download of the metrics may take a while.