Free Access
Fig. 12
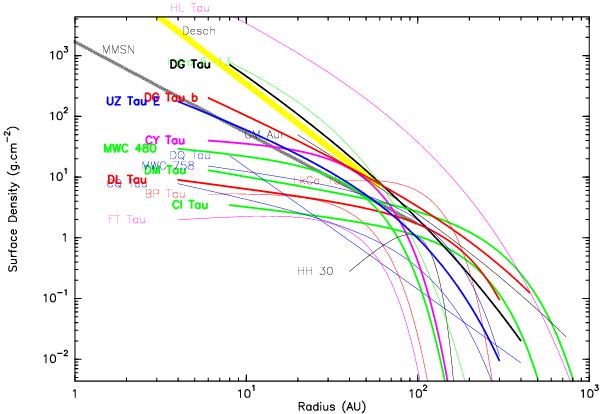
Surface densities of observed sources. Thick lines are for sources in which a variation of β and thus κ with radius was derived. Thin lines are for sources for which we assumed κ(1.3 mm) = 2 cm2 g-1. The gray line is the MMSN, while the yellow area indicates the Solar Nebula from Desch (2007).
Current usage metrics show cumulative count of Article Views (full-text article views including HTML views, PDF and ePub downloads, according to the available data) and Abstracts Views on Vision4Press platform.
Data correspond to usage on the plateform after 2015. The current usage metrics is available 48-96 hours after online publication and is updated daily on week days.
Initial download of the metrics may take a while.