| Issue |
A&A
Volume 529, May 2011
|
|
|---|---|---|
| Article Number | A156 | |
| Number of page(s) | 15 | |
| Section | Stellar structure and evolution | |
| DOI | https://doi.org/10.1051/0004-6361/201015133 | |
| Published online | 22 April 2011 | |
Probing thermonuclear supernova explosions with neutrinos⋆
1
Marian Smoluchowski Institute of Physics, Jagiellonian
University, Reymonta
4, 30-059
Cracow, Poland
e-mail: This email address is being protected from spambots. You need JavaScript enabled to view it.
2
Department of Scientific Computing, Florida State
University, Tallahassee, FL
32306,
USA
Received:
2
June
2010
Accepted:
8
March
2011
Abstract
Aims. We present neutrino light curves and energy spectra for two representative type Ia supernova explosion models: a pure deflagration and a delayed detonation.
Methods. We calculate the neutrino flux from β processes using nuclear statistical equilibrium abundances convoluted with approximate neutrino spectra of the individual nuclei and the thermal neutrino spectrum (pair+plasma).
Results. Although the two considered thermonuclear supernova explosion scenarios are expected to produce almost identical electromagnetic output, their neutrino signatures appear vastly different, which allows an unambiguous identification of the explosion mechanism: a pure deflagration produces a single peak in the neutrino light curve, while the addition of the second maximum characterizes a delayed-detonation. We identified the following main contributors to the neutrino signal: (1) weak electron neutrino emission from electron captures (in particular on the protons 55Co and 56Ni) and numerous β-active nuclei produced by the thermonuclear flame and/or detonation front, (2) electron antineutrinos from positron captures on neutrons, and (3) the thermal emission from pair annihilation. We estimate that a pure deflagration supernova explosion at a distance of 1 kpc would trigger about 14 events in the future 50 kt liquid scintillator detector and some 19 events in a 0.5 Mt water Cherenkov-type detector.
Conclusions. While in contrast to core-collapse supernovae neutrinos carry only a very small fraction of the energy produced in the thermonuclear supernova explosion, the SN Ia neutrino signal provides information that allows us to unambiguously distinguish between different possible explosion scenarios. These studies will become feasible with the next generation of proposed neutrino observatories.
Key words: hydrodynamics / neutrinos / nuclear reactions, nucleosynthesis, abundances / supernovae: general
Figures 9 to 20 are available in electronic form at http://www.aanda.org
© ESO, 2011
1. Introduction
The origins of type Ia supernovae (SN Ia) remain one of the major unsolved problems of stellar evolution (Höflich & Stein 2002; Kuhlen et al. 2006; Piro 2008; Zingale et al. 2009). The commonly accepted theoretical framework considers an explosion scenario in which a massive white dwarf slowly gains mass in the process of accretion from a non-degenerate companion (Whelan & Iben 1973; Yoon & Langer 2003; Han & Podsiadlowski 2004; Meng & Yang 2010). Alternatively, the degenerate matter might be ignited in the process of a violent merger of binary white dwarfs (Iben & Tutukov 1984; Webbink 1984; Han 1998). The latter channel might be a dominant source of thermonuclear events in early type galaxies (Gilfanov & Bogdán 2010; Wang et al. 2010), while there is no consensus as to which evolutionary process dominates in other environments (Scannapieco & Bildsten 2005; Raskin et al. 2009; Ruiter et al. 2009; Schawinski 2009).
Our progress toward understanding these events is hampered by the relatively low luminosity of their progenitors, and to date the evidence is largely circumstantial and exclusively indirect (Ruiz-Lapuente et al. 2004; Badenes et al. 2007; Schawinski 2009; Gilfanov & Bogdán 2010). This stays in contrast with numerous identifications of core-collapse progenitors (Smartt 2009; Leonard 2009, and references therein). Furthermore, the nature of the explosion process is very uncertain, though it is commonly accepted that the energy source of the explosion is a thermonuclear burn (Hoyle & Fowler 1960). For a single-degenerate channel, the nuclear fuel is expected to burn first subsonically (Nomoto et al. 1976) with a likely transition to detonation at a later time (Khokhlov 1991; Woosley & Weaver 1994). It is much less clear what the ultimate fate of the merger is (Hachisu et al. 1986; Saio & Nomoto 1985; Yoon et al. 2007; Pakmor et al. 2010), and perhaps additional routes to an explosion are admissible (Podsiadlowski et al. 2008; Podsiadlowski 2010, and references therein). These questions along with the role that SN Ia play in studies of the early universe (Sandage & Tammann 1993; Riess et al. 1998; Phillips 2005; Wood-Vasey et al. 2007; Ellis et al. 2008; Riess et al. 2009; Kessler et al. 2009) motivate our search for additional sources of information about thermonuclear supernovae, and in particular about the explosion process.
Neutrinos are a proven source of information about astrophysical objects and phenomena, such as the Earth (Smirnov 2009; Araki et al. 2005; Dye 2006), and engineering systems such as nuclear power plants (Bowden 2008; Lhuillier 2009; Learned 2005; Guillian 2006). The Sun is one of the best-studied astrophysical neutrino sources thanks to its proximity and constancy of the νe flux (Bahcall 1989). Solar neutrino studies were first conducted using radiochemical detectors (Cleveland et al. 1998; Hampel et al. 1999) and more recently also in real-time (BOREXINO Collaboration et al. 2008; Arpesella et al. 2008; Fukuda et al. 2001; Ahmad et al. 2001). For contemporary non-solar neutrino experiments, the solar neutrino signal caused by the dominant reactions (pp, 8B) constitutes somewhat undesirable background. However, supernova SN 1987A
(Arnett et al. 1989) has been clearly observed in neutrinos in many detectors (Van Der Velde et al. 1988; Hirata et al. 1987; Galeotti et al. 1987; Alekseev et al. 1987) despite its nearly extragalactic distance (~50 kpc). The event has been the main trigger for intensive theoretical studies and modeling in the recent years (Immler et al. 2007; Nakahata & Sobel 2007) while a possibility of neutrino detection and obtaining neutrino energy spectra from core-collapse supernovae (Burrows 1990; Keil et al. 2003) attracted constant attention of theorists (Kistler et al. 2008; Fogli et al. 2005a; Ando et al. 2005; Fogli et al. 2005b) and stimulated experimental developments (Suzuki 2001; Learned 2004). Neutrino detection is a mature field of research nowadays. For instance, a stellar core-collapse at a distance <4 kpc will produce a signal strong enough to saturate the Super-Kamiokande detector (Nakahata 2007). Therefore, it is natural to consider the detectability of neutrinos from previously ignored sources, including thermonuclear supernova events.
As originally suggested by Nomoto et al. (1993), the neutrino signal produced by the thermonuclear deflagrations offers direct insight into the explosion process. Clearly, such observations would be extremely helpful in directing future SN Ia research and may possibly allow for distinguishing between various stellar evolution and explosion scenarios. A striking differences between neutrino emission from deflagrations and delayed detonations has been noted by Nomoto et al. (1993). More recently, in a series of articles Kunugise & Iwamoto (Iwamoto & Kunugise 2006; Kunugise & Iwamoto 2007) studied the νe light curve and spectra from the standard W7 explosion model (Nomoto et al. 1984) and discussed the detectability of this type of event by the Super-Kamiokande detector. We aim to extend those early studies to recent multi-dimensional thermonuclear supernova explosion models. We obtain supernova neutrino light curves and energy spectra for pure deflagration and delayed detonation explosion models. We show that the predicted neutrino signatures are markedly different in those two cases and can be used to identify the explosion mechanism.
2. Neutrino emission from thermonuclear supernovae
Neutrino emission from a type Ia supernova is considered negligible in most of the thermonuclear explosion models because the weak interaction rates are too slow compared to the hydrodynamic timescale (see Arnett 1996, Sect. 9.1) and the matter is essentially completely transparent to neutrinos. However, it is conceivable that if the amount of the energy emitted via neutrinos is significant compared to the energy produced in the thermonuclear burning, the neutrino cooling may play an important role in the explosion dynamics. In either case, neutrinos may provide important insights into the SN Ia explosion mechanism.
Neutrino emission from the existing SN Ia explosion models can be computed by post-processing snapshots of the hydrodynamical simulations. For the thermal neutrino emission this is a straightforward procedure because the neutrino spectrum only depends on the temperature and the (electron) density of the plasma. For weak nuclear processes, we have to know the isotopic composition of the plasma. Given the current computational resources, it is not feasible to include large nuclear reaction networks in multidimensional explosion model. The situation, however, is not completely hopeless because the hottest regions associated with thermonuclear flames and detonations, which is also where the neutrino emission is expected to be relatively high, are in the nuclear statistical equilibrium (NSE) (see Clayton 1984, Sect. 7.2). Under NSE conditions, isotopic abundances are determined solely by the thermodynamic properties of the plasma. Therefore, in the most important regions of the exploding star, we are again able to post-process models and compute required abundances. Once the isotopic composition is known, computing a neutrino emission is relatively straightforward (Kunugise & Iwamoto 2007).
In NSE, the isotopic composition of the matter is fully determined by the density, temperature, and electron density of the plasma (Clifford & Tayler 1965a,b). The NSE conditions are characterized by
-
1.
a very high temperature to break-up the most strongly bound nuclei;
-
2.
an evolutionary timescale long enough to allow for re-arranging of nucleons into equilibrium nuclei via strong/electromagnetic interactions.
For completeness we will discuss shortly the major properties of the considered neutrino emission processes. Model neutrino spectra are computed with help of the PSNS code (Odrzywolek 2005–2010).
2.1. Sources of neutrinos
2.1.1. Thermal processes
Three “classic” neutrino processes,  are the major source of the so-called
thermal neutrinos (Munakata et al. 1985; Schinder et al. 1987; Esposito et al. 2003): annihilation of the e+e−
pairs into neutrinos (Eq. (1a), Misiaszek et al. 2006); plasmon decay (Eq. (1b), Braaten
1991; Braaten & Segel 1993), and
photoemission (Eq. (1c), Dutta et al. 2004). Emissivity and spectra of these
neutrinos are uniquely determined by the plasma temperature and electron density. All
flavors of the neutrinos are produced in these processes:
are the major source of the so-called
thermal neutrinos (Munakata et al. 1985; Schinder et al. 1987; Esposito et al. 2003): annihilation of the e+e−
pairs into neutrinos (Eq. (1a), Misiaszek et al. 2006); plasmon decay (Eq. (1b), Braaten
1991; Braaten & Segel 1993), and
photoemission (Eq. (1c), Dutta et al. 2004). Emissivity and spectra of these
neutrinos are uniquely determined by the plasma temperature and electron density. All
flavors of the neutrinos are produced in these processes:
 .
Following the standard theory of electroweak interactions, the fluxes for all flavors
are quite similar, yet some differences exist between the electron and
μ/τ flavors. Additionally, because of the parity
violation, neutrino and antineutrino energies are not equal under the degenerate
conditions considered here (Odrzywołek 2007;
Misiaszek et al. 2006).
.
Following the standard theory of electroweak interactions, the fluxes for all flavors
are quite similar, yet some differences exist between the electron and
μ/τ flavors. Additionally, because of the parity
violation, neutrino and antineutrino energies are not equal under the degenerate
conditions considered here (Odrzywołek 2007;
Misiaszek et al. 2006).
Pair annihilation neutrino fluxes and spectra were calculated according to Misiaszek et al. (2006). This approach is superior to both the Itoh et al. (1996a) method, which is typically used in stellar evolution calculations (because the neutrino flavors are not summed up) and the Bruenn (1985); Burrows & Thompson (2002) method that is used for core-collapse supernova modeling (because the electron rest mass is not neglected).
The plasma neutrino flux and spectrum were calculated according to Odrzywołek (2007). Procedures were tested against the Itoh et al. (1992), Kohyama et al. (1994), and Itoh et al. (1996b) tables (calculated using slightly different dispersion relations for plasmons) with reasonable agreement, and also against the recent calculations of Kantor & Gusakov (2007). In the latter case, the results agree up to the machine precision.
The photoneutrino process and thermal processes of a lesser importance (e.g. neutrino bremsstrahlung, cf. Yakovlev et al. 2001) were omitted in our calculations, because of the lack of relevant results on the neutrino spectrum. This may lead to a negligible underestimate of the thermal neutrino flux.
2.1.2. Weak nuclear processes
Weak processes, namely electron/positron captures on both nucleons and nuclei and
β ± decays are extremely important in the astrophysical
environments. They are essential ingredients of, e.g., massive star evolution
(especially pre-supernova phase, Kutschera et al.
2009), core-collapse supernovae, and thermonuclear explosions: X-ray flashes,
novae and SN Ia. Weak nuclear neutrino processes usually work in the cycles such as:
 and the total number of emitted neutrinos per nucleus is usually not
equal to 1, in contrast to terrestrial beta decays and electron captures.
and the total number of emitted neutrinos per nucleus is usually not
equal to 1, in contrast to terrestrial beta decays and electron captures.
One of the most important motivations for including the weak nuclear rates was a search
for nuclei producing  or νe, which leads to a very strong signal in the detectors
(in analogy to Solar 8B neutrinos). These nuclei must meet three conditions:
(1) they have to be abundant in NSE, (2) they need posses very high β
or a very high capture rate, and (3) they need to emit energetic
νe or
with energies above, say, 10–15 MeV. Unfortunately, an inspection of Figs. 6, 7 and
Table 2 reveals no such nuclei in our study. A
strong degeneracy during the initial stage of the deflagration enhances transitions with
relatively high-energy neutrinos (we thank G. Fuller for pointing out this important
aspect to us). For some nuclides, e.g. 57Zn, 54Cr, and
28P, the average neutrino energy
⟨ ℰνe ⟩ reaches 15 MeV. The NSE abundance and
therefore the neutrino flux from these nuclides is negligible (cf. Fig. 6). The nucleus producing the highest elastic
scattering event rate is 55Co, but equally important are electron captures on
protons. The case of 54Co, with a quite high average neutrino energy (≈9 MeV)
is very interesting and deserves a more detailed analysis.
or νe, which leads to a very strong signal in the detectors
(in analogy to Solar 8B neutrinos). These nuclei must meet three conditions:
(1) they have to be abundant in NSE, (2) they need posses very high β
or a very high capture rate, and (3) they need to emit energetic
νe or
with energies above, say, 10–15 MeV. Unfortunately, an inspection of Figs. 6, 7 and
Table 2 reveals no such nuclei in our study. A
strong degeneracy during the initial stage of the deflagration enhances transitions with
relatively high-energy neutrinos (we thank G. Fuller for pointing out this important
aspect to us). For some nuclides, e.g. 57Zn, 54Cr, and
28P, the average neutrino energy
⟨ ℰνe ⟩ reaches 15 MeV. The NSE abundance and
therefore the neutrino flux from these nuclides is negligible (cf. Fig. 6). The nucleus producing the highest elastic
scattering event rate is 55Co, but equally important are electron captures on
protons. The case of 54Co, with a quite high average neutrino energy (≈9 MeV)
is very interesting and deserves a more detailed analysis.
Some of the nuclei also produce relatively energetic antineutrinos, e.g.
⟨ ℰνe ⟩ ≈ 6 MeV for 56V and
58V during the deflagration and detonation stages. The corresponding flux,
however, is low compared to thermal (pair) and  electron antineutrinos fluxes. We conclude that the β processes
involving nuclei provide only a negligible contribution to the
electron antineutrinos fluxes. We conclude that the β processes
involving nuclei provide only a negligible contribution to the
 flux.
flux.
While the energy loss rate as well as the decrease of the electron fraction because of weak processes were extensively studied in the past (Fuller et al. 1980, 1982a,b; Oda et al. 1994; Aufderheide et al. 1994a,b; Caurier et al. 1999; Langanke & Martínez-Pinedo 2000; Nabi & Klapdor-Kleingrothaus 1999; Seitenzahl et al. 2009; Juodagalvis et al. 2010, and references therein), relatively little is known about the combined energy spectrum of these neutrinos (Langanke et al. 2001; Odrzywolek 2009). Typically, the spectrum is integrated in advance and the results are tabulated. This approach saves both computer memory and computing time. To restore information about the spectrum, a simple parameterization (e.g. the Fermi-Dirac distribution) is assumed (see, e.g. Pons et al. 2001). We employ a similar method here. However, some fine details of the nuclear structure reflected in the neutrino spectrum are lost when using this approach. In certain conditions, this may lead to a serious underestimate of the neutrino signal, especially in the high-energy (ℰν > 10 MeV) tail. With this in mind, our results provide a lower detection threshold for the neutrino signal. Furthermore, some newest results suggest an upward revision of the crucial 55Co electron capture rate by up to two orders of magnitude (Nabi & Sajjad 2008). These findings apparently are in conflict with the nucleosynthesis results though, in particular with the observed degree of neutronization of the ejecta (Nomoto et al. 1997; Isern et al. 1993; Thielemann 1984; Iwamoto et al. 1999).
Our calculations of the weak nuclear neutrino emission proceed as follows. In contrast to the thermal neutrino emission, the contribution from weak nuclear processes to the neutrino signal cannot be calculated solely based on the thermodynamic properties of matter. These calculations in general require detailed knowledge of the isotopic composition. Typically, the composition is a result of the long and complicated history of the astrophysical object. Because the electron fraction has not been calculated consistently in the adopted explosion models, we assume Ye = 0.5. This value corresponds to the initial electron fraction of the progenitor with 50/50 carbon/oxygen composition mix used in the explosion calculations1. In more realistic models, the electron neutrino emission would result in decreasing Ye. For example, the NSE abundance of the 55Co nucleus, which significantly contributes to the νe flux, decreases rapidly for Ye < 0.5.
The remaining required information about the matter density, ρ, and
the temperature, T, is obtained from the actual explosion model. We
consider only regions where the NSE state can be established on a timescale shorter than
the explosion timescale. The NSE timescale can be approximated as (Khokhlov 1989, 1991)
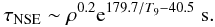 (3)For the reference NSE threshold
temperature, TNSE = 5 × 10⁹ K
(T9 = 5, kT ≈ 0.432 MeV) , adopted after
Kunugise & Iwamoto (2007) and the
characteristic density of ρ = 109 g cm-3, the
NSE timescale is, τNSE ≈ 0.66 s, and is shorter than than
the explosion timescale, τexp ≈ 1 s.
(3)For the reference NSE threshold
temperature, TNSE = 5 × 10⁹ K
(T9 = 5, kT ≈ 0.432 MeV) , adopted after
Kunugise & Iwamoto (2007) and the
characteristic density of ρ = 109 g cm-3, the
NSE timescale is, τNSE ≈ 0.66 s, and is shorter than than
the explosion timescale, τexp ≈ 1 s.
To estimate the sensitivity of the results to the assumed NSE threshold temperature, we performed several additional calculations with the threshold temperature T9 = 6 (kT ≈ 0.517 MeV, τNSE ~ 10-3 s). This resulted in a reduction of the total neutrino flux by a few percent. The remaining non-NSE zones were omitted from the weak neutrino emission calculations2. Their contribution remains unknown at present, but it is unlikely to be important.
For zones with T > TNSE, the NSE
abundances were calculated using an 800 isotope network up to 97Br (Odrzywolek 2009). From the NSE abundances, we
selected nuclei (188 nuclides) for which weak rates have been tabulated by Fuller et al. (1980, 1982a,b). Model energy spectra for
neutrinos from electron captures on protons and for antineutrinos from positron captures
on neutrons and neutron decay were calculated using  (4)where
Rν is the particle production rate per
unit volume and time, ℰν is the neutrino energy,
reff and Qeff describe adopted
parameterization (see Langanke et al. 2001, for
details), Θ is the unit step function, upper and lower sign correspond to captures and
decays, respectively, and the other symbols have their usual meanings. To account for
positron captures (ϵ+) and β+
decays, one simply needs to change the sign of μ (the electron chemical
potential including rest mass) in Eq. (4). The neutrino spectra were calculated using Eq. (4)with the effective Q-values and effective
rates (Langanke et al. 2001; Kunugise & Iwamoto 2007) with additional
switching between capture and decay (Odrzywolek
2009). The above procedure reproduces neutrino fluxes and average neutrino
energies of the original tabulated values at the FFN grid points. Between grid points,
we used a bilinear interpolation of the effective rates and Q-values (Fuller et al. 1985). The electron chemical potential
required in Eq. (4)was computed
separately with a precision better than 1 × 10-12.
(4)where
Rν is the particle production rate per
unit volume and time, ℰν is the neutrino energy,
reff and Qeff describe adopted
parameterization (see Langanke et al. 2001, for
details), Θ is the unit step function, upper and lower sign correspond to captures and
decays, respectively, and the other symbols have their usual meanings. To account for
positron captures (ϵ+) and β+
decays, one simply needs to change the sign of μ (the electron chemical
potential including rest mass) in Eq. (4). The neutrino spectra were calculated using Eq. (4)with the effective Q-values and effective
rates (Langanke et al. 2001; Kunugise & Iwamoto 2007) with additional
switching between capture and decay (Odrzywolek
2009). The above procedure reproduces neutrino fluxes and average neutrino
energies of the original tabulated values at the FFN grid points. Between grid points,
we used a bilinear interpolation of the effective rates and Q-values (Fuller et al. 1985). The electron chemical potential
required in Eq. (4)was computed
separately with a precision better than 1 × 10-12.
2.2. Representative SN Ia explosion models
For the neutrino explosion diagnostic analysis, we selected two representative explosion models from our database (Plewa 2007): a pure deflagration, n7d1r10t15c, and a delayed detonation, Y12. Both models were obtained for a standard carbon/oxygen Chandrasekhar mass white dwarf. A slightly modified flame capturing method of Khokhlov (1995) was used to follow a deflagration, and we used a 13-isotope alpha-network to directly compute the energetics of the detonation wave. Both models are relatively energetic with explosion energies between ≈0.97 B (1 Bethe ≡ 1 B = 1 × 1051 erg) for the pure deflagration and ≈1.36 B for the delayed-detonation.
2.3. Detailed analysis of the neutrino emission
For the selected explosion models, we computed the neutrino emission resulting from pair
annihilation, plasmon decay and weak nuclear processes. The results are presented in the
form of emissivity maps and total fluxes. Additionally, we provide time-dependent neutrino
energy spectra in numerical form (see Figs. 9–20). Following practice known from
core-collapse supernova studies, we show individual neutrino emission light curves for
electron neutrinos (νe), electron antineutrinos
()
and the average of the remaining four muon and tau neutrinos
(νμ). The latter are produced exclusively
in thermal processes, as long as we neglect neutrino oscillations. The electron neutrino
(νe) flux is dominated either by electron captures on
protons and iron group nuclei3 (when the burning is
the most intense) or by pair annihilation (otherwise).
Electron antineutrinos ()
are produced mainly in the pair process and through positron captures on neutrons. Heavy
nuclei (β− decays and e+ captures) do not
significantly contribute to the total
flux. Muon and tau neutrinos are produced in much smaller quantities only in the thermal
processes, and one may expect that actually more μ/τ
neutrinos are produced owing to flavor conversion between source and detector (see Fig. 3
in Kunugise & Iwamoto 2007). Plasmon decay is
almost negligible because of the low densities, and the low energy of the emitted
neutrinos (~few keV, Odrzywołek 2007) makes
their detection essentially impossible.
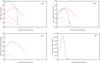 |
Fig. 1 Model neutrino luminosities of the pure deflagration n7d1r10t15c. a)
Electron neutrinos,
Lνe; b)
electron anti-neutrinos, |


2.3.1. Pure deflagration model
Pure deflagrations produce neutrino emission with a single maximum (because an explosion involves only one stage), and nuclear burning takes ≈1 s. We calculate the total neutrino flux (Fig. 1d) as the sum of thermal and weak components. The evolution is slower compared to a detonation (see below), and in this case therefore neutrino cooling processes are given more time compared to a detonation. Moreover, a larger volume is involved in neutrino cooling in deflagration compared to a “failed” case, Y12 (cf. Fig. 2 versus Fig. 4). Overall the neutrino luminosity is much higher compared to Y12 model and reaches 1.92 × 1050 erg/s, almost one order of magnitude larger compared to the first-peak luminosity of the Y12 model (1.1 × 1049 erg/s). The total energy radiated in neutrinos is 0.04 B, five times more than for Y12 (0.008 B), but still small compared to the overall explosion energy of ≈1 B.
The temporal evolution of the neutrino emission in the deflagration model is shown in
Fig. 1a (νe),
Fig. 1b (),
Fig. 1c
(νμ), with the total neutrino
luminosity shown in Fig. 1d. Overall, the emission
varies smoothly in time and we notice only very small emission fluctuations. Even though
the flame is geometrically very convoluted (Fig. 2), the neutrino emission is produced in regions of nearly identical density and
temperature. We found that most (99%) of the NSE neutrino flux is produced for
TNSE < T9 < 10 and
8.9 < log 10ρ < 9.3. At the peak neutrino emission,
only 3% of the total white dwarf mass is emitting neutrinos.
We note that the model neutrino emission obtained in our axisymmetric deflagration is very similar to that of the spherically symmetric model W7 (Nomoto et al. 1984, 1993; Kunugise & Iwamoto 2007). This suggests that the neutrino emission from pure deflagrations may have a generic form. To verify this impression, we computed the neutrino light curves for two other deflagration models presented by (Plewa 2007), n11d2r10t15a and n11d2r20t20b. In both cases the neutrino emission displayed very similar characteristics to W7 and the deflagration model analyzed in detail here. The generic form of the emission also implies that neutrinos may provide no information helpful for separating between various scenarios of pure deflagrations.
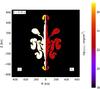 |
Fig. 2 Maps of the neutrino emissivity in the pure deflagration model at
t = 0.5 s, i.e. near the peak of the neutrino emission; left
segment, R < 0 km νe; right
segment, R > 0 km |
2.3.2. Delayed-detonation model
In contrast to the pure deflagrations, the delayed-detonation class of models produces multi-peak neutrino emission. The two distinct neutrino emission maxima caused by the initial deflagration stage and delayed detonation can be clearly discerned (Fig. 3). The deflagration peak is completely dominated by the νe emission from the electron captures. The detonation peak, while still dominated by the weak nuclear processes, includes a significant fraction of the thermal emission. Actually, pair annihilation dominates after end of rapid detonation stage and form an exponentially decaying tail. This is the result of the efficient neutrino cooling in the large volume of the former white dwarf that is overrun by the detonation wave (cf. Fig. 5).
The electron flavor neutrino and antineutrino emission maps (Figs. 4 and 5) reflect the explosion physics. Roughly speaking, neutrino emission is a by-product of the thermonuclear flame or the detonation wave. During the deflagration stage, almost all νe are emitted in the electron capture processes in the region incinerated by the thermonuclear flame. Hot plumes expanding into the higher density gas are prominent sources of electron neutrinos, because the electron capture rates are increasing rapidly with the temperature (because of the thermal population of the excited states with large matrix elements) and density (because of the Fermi-energy crossing capture threshold for excited nuclei). The total mass involved in neutrino emission is much smaller than for pure deflagration model, 0.2% of the total white dwarf mass.
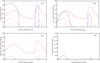 |
Fig. 3 Model neutrino luminosities of the delayed detonation Y12. a)
Electron neutrinos,
Lνe; b)
electron antineutrinos, |
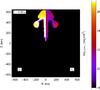 |
Fig. 4 Maps of the neutrino emissivity in the delayed-detonation model at
t = 0.8 s, i.e. near the peak of the neutrino emission produced
by the initial failed deflagration stage; left segment,
R < 0 km νe; right segment,
R > 0 km |
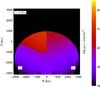 |
Fig. 5 Maps of the neutrino emissivity in the delayed-detonation model at
t = 3.9 s, i.e. near the peak of the neutrino emission produced
by the detonation stage; left segment, R < 0 km
νe; right segment,
R > 0 km |
Antineutrinos ()
are emitted from the much larger volume heated by the thermonuclear burning. The
electron antineutrino emission from the thermal processes (pair annihilation) during the
deflagration stage is initially suppressed owing to the high degeneracy of the electron
gas. The main source of ’s
is pair annihilation, Eq. (1a), and the
reaction  After t ≈ 1 s, pair
annihilation completely dominates the
flux (Fig. 3b, red solid curve).
After t ≈ 1 s, pair
annihilation completely dominates the
flux (Fig. 3b, red solid curve).
The deflagration stage ends with a bubble breakout and the neutrino emission from nuclear processes ends. Thermal neutrinos are still emitted from the area heated during nuclear burning, but the neutrino flux decreases by several orders of magnitude (see Figs. 3a–c). At t = 3.7 s, the material accelerated by the expanding bubble starts converging at the location opposite to the bubble breakout point, and eventually triggers a detonation. Interestingly, the thermal neutrino emission starts to rise just before to the detonation ignition (Fig. 3c). This is because of the neutrino cooling of the colliding matter, which heats up enough to produce e+e− pairs. Once the detonation4 is formed, the wave quickly moves into the white dwarf core. The nuclear burning involves electron captures, and weak nuclear neutrinos are the dominant component of the neutrino emission (left segment in Fig. 5).
Integrated properties of the model neutrino signals.
In contrast to the pure deflagration, during the detonation phase a large fraction of
the white dwarf (≈30% in mass) is participating in producing the neutrino emission. We
found that in this case ≈50% of the emission is produced by matter with
TNSE < T9 < 7.2 and
7.85 < log 10ρ < 8.25. Thermal neutrinos are also
emitted from a much larger volume (of the deflagration-expanded white dwarf) swept by
the detonation (see right panel in Fig. 5), and
they are the main contributor to the
flux. Only residual pair neutrino emission from the deflagration stage can still be seen
at this time. Once the detonation ends, however, the ejecta quickly expand and cool down
adiabatically, and the supernova becomes an exponentially fading source of thermal
neutrinos5.
2.3.3. Comparison of neutrino emission signatures
One of the most exciting possibilities opened by the neutrino channel is a potential
for distinguishing between various explosion scenarios. While the overall number of
scenarios is quite large, most of them fit into either the pure deflagration or the
delayed-detonation category. Therefore, the two models analyzed in previous sections
provide a small but representative sample. We have at least three observables available
for the explosion diagnostics: the total energy radiated by neutrinos (directly related
to the observed number and energy of events), the time variation of the neutrino signal
(sensitive to the burning speed and burning type), and the energy of detected neutrinos
(probing the degeneracy of the burning matter). The analyzed models differ quite
significantly in these three respects (see Table 1). The most striking difference is the total emitted neutrino energy, which
almost entirely comes from the electron flavor neutrino. The delayed-detonation model
produces five times less energy in neutrinos despite a comparable explosion energy.
Therefore, if we look at a nearby explosion that is unobscured by interstellar matter,
we can easily identify the explosion scenario provided the total (kinetic+radiative)
explosion energy can be determined. Neutrino energies are also a little bit smaller in
the delayed-detonation model (Table 1).
Unfortunately, only νe provides a clear signature. Other
neutrino flavors, including relatively easy to detect
,
are emitted in comparable quantities. The total energy radiated in
is ≈7.0 × 1046 erg for n7d1r10t15c, comparable to
≈6.2 × 1046 erg for Y12. The average
energy in the Y12 model (3.5 MeV) is only 0.3 MeV lower than a pure deflagration
(3.8 MeV).
The characteristic double-peaked neutrino luminosity curve (Fig. 3) is a “smoking gun” of the delayed-detonation supernova, although the second maximum is fairly weak. However, owing to the ≈4 s delay between the maxima, and compared to ≈2.5 s long deflagration, a detection of a neutrino events a few seconds apart would offer evidence for an explosion caused by a delayed detonation.
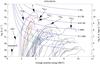 |
Fig. 6 Neutrino-HR diagram for the n7d1r10t15c model. Every curve is a track on a Fνe− ⟨ ℰνe ⟩ plane produced by a single nucleus/ thermal process. Assuming a single parameter neutrino energy spectrum (Eq. (5)), we are able to immediately select the most interesting for further analysis processes and estimate the expected signal in a given neutrino detection channel. Particularly, we present detection of νe using elastic scattering off electrons with the threshold for detection of the electron kinetic energy of 4 MeV in a water Cherenkov detector. |
3. Discussion
3.1. Prospects for neutrino detection from a galactic type Ia supernova
In the context of SN Ia neutrino emission, possibly the most important question is
whether the supernova neutrino signal can be measured using the available
neutrino-detection technologies. To answer this question one requires the following
information: (1) estimated galactic supernova rates and expected supernova distances, (2)
the integrated supernova neutrino (νe) and antineutrino
()
spectra; (3) characteristics of suitable neutrino detector. In the following discussion we
will consider a supernova located at the distance of 1 kpc6. The results for a widely adopted 10 kpc distance (roughly a distance to the
Galactic Center with the corresponding volume including ≈50% stars in the Milky Way,
Bahcall & Soneira 1980) can be obtained by
dividing the current numbers by a factor of 100.
The selection of the interesting nuclei and processes of interest is potentially quite
complicated because of large number of the nuclei involved in NSE neutrino emission, each
with unique (often poorly known) spectral properties, and contribution from additional
thermal processes. To aid the selection process, we constructed a diagram showing the
temporal evolution of neutrino emission from individual nuclides and/or processes
integrated over the stellar volume as a function of the neutrino energy7. Specifically, we plot
(⟨ ℰν ⟩ (t),Fν(t))
on the
Fν- ⟨ ℰν ⟩
plane. This diagram might be referred to as the ν-HR diagram, with the
mean neutrino energy considered an analogue of the effective stellar temperature and the
neutrino flux now playing a role of the stellar bolometric luminosity. For a given
supernova distance and detector, one can also show isocontours of detection rates. Because
the knowledge of the mean neutrino energy and integrated flux is not sufficient to
reproduce the energy spectrum, in calculating detection rates we are forced to assume a
single parameter spectral function. In neutrino astrophysics, it is common to use the
Fermi-Dirac function (Kiełczewska 1990):
 (5)where R(t)
is the integrated particle emission rate and
⟨ ℰν ⟩ (t) the average neutrino energy
dependent only on time, and a and b normalize the
spectrum.
(5)where R(t)
is the integrated particle emission rate and
⟨ ℰν ⟩ (t) the average neutrino energy
dependent only on time, and a and b normalize the
spectrum.
For the assumed supernova distance of 1 kpc, the results for a pure deflagration model and a Super-Kamiokande class detector (H2O target with the Cherenkov light detector with a threshold of 4 MeV) are shown in Fig. 6. In particular, we conclude from the results shown in Fig. 6:
-
(1)
the most important neutrino-producing nuclei for Super-Kamiokande-like detector events terms are free protons and 55Co; the expected event rate is in 1 kt of H2O up to 0.1/s: because an explosion takes ≈1 s in the Super-Kamiokande we expect up to 0.1/s/kt × 32kt × 2nuclei ≈6 events from 1 kpc;
-
(2)
secondary sources of detectable signal are: 56Ni, 56Co, 53Fe and 54Co with mean energies of ≈3 MeV, ≈4 MeV, ≈6 MeV, and ≈9 MeV, respectively;
-
(3)
numerous other nuclei as well as thermal processes produce either a weak or an undetectable signal.
 |
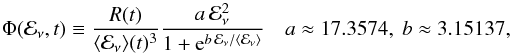
Fig. 7 Antineutrino-HR diagram for Y12 model. Similar to Fig. 6, but now we consider a detection of
|
Expected number of events triggered in the select proposed neutrino detectors by a thermonuclear supernova located at a distance of 1 kpc.
The results of similar analyses for antineutrinos from the delayed-detonation model, Y12,
are shown in Fig. 7. We consider the inverse beta
decay ( )
as the detection channel, and a Gd-loaded water Cherenkov detector proposed by Beacom & Vagins (2004) or a liquid scintillator
detector, e.g. KamLAND (Eguchi et al. 2003). We
note that here the detection method is simply the inverse of the essential production
process (
)
as the detection channel, and a Gd-loaded water Cherenkov detector proposed by Beacom & Vagins (2004) or a liquid scintillator
detector, e.g. KamLAND (Eguchi et al. 2003). We
note that here the detection method is simply the inverse of the essential production
process ( ).
The analysis of Fig. 7 leads to the following
conclusions:
).
The analysis of Fig. 7 leads to the following
conclusions:
-
(1)
most important for
emission processes are pair-annihilation and positron capture on neutrons; -
(2)
weak nuclear processes from nuclei are negligible;
-
(3)
the expected event rate is very low (~few mHz/kt@1 kpc); at least a half-megaton detector is required to observe a single event from 1 kpc.
Following the analysis of the νe,
detection in other cases, we selected five most promising SN Ia neutrino experiments:
-
1.
IBD2: inverse beta decay
 utilized in a large 50 kiloton target liquid scintillator detector (e.g. LENA Autiero et al. 2007; Marrodán-Undagoitia et al. 2006; Oberauer et al. 2005) or Gd-loaded water detector (Beacom & Vagins 2004) with 1.8 MeV threshold;
 -
2.
ES0: elastic scattering off electrons νe + e− → νe + e− in a large 50 kt liquid scintillator (LENA) assuming ≈0.2 MeV threshold;
-
3.
ES4: elastic scattering off electrons νe + e− → νe + e− in the extremely large water Cherenkov detector Memphys (Autiero et al. 2007; Rubbia 2009), Titan-D (Suzuki 2001, 2008; Kistler et al. 2008), LBNE W.C. (Scholberg 2010) etc. assuming a standard 4.0 MeV detection threshold for recoil electrons;
-
4.
LAr: neutrino absorption in 100 kt of liquid argon (see e.g. Rubbia 2009, GLACIER proposal) detected using coincidence of electrons and delayed gammas (νe + 40Ar → 40K ∗ + e−, Raghavan 1986) and elastic scattering off electrons (Eth = 5 MeV);
-
5.
PES: elastic scattering off protons in an advanced extremely low-background liquid scintillator detector like Borexino (Alimonti et al. 2009);
-
COS: coherent elastic scattering off high A nuclei (e.g. 72Ge) in a detector with a threshold on the order of 100 eV.
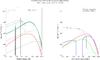
Fig. 8 The νe (left) and
(right) model spectra of a pure deflagration supernova near
the maximum of the neutrino emission and other recently studied sources. The
supernova emission level is for an event located at a distance
d = 10 kpc. References for the data used: solar neutrinos,
Bahcall et al. (2005); geoneutrinos
at Kamioka, Japan, Enomoto (2005, 2006); DSNB, Lien et al. (2010).
Table 2 shows the expected number of neutrino events for prospective neutrino experiments. For a delayed-detonation, we separated the contributions from the initial deflagration and the following delayed detonation. For weak neutrinos and antineutrinos, the total number of expected events is simply the sum of events produced in individual explosion stages. For thermal neutrinos, there is also a minor contribution from the neutrinos emitted during the period that separates the two explosion stages and during the final expansion stage. Clearly, the largest yield comes from the νe emission from electron captures during the deflagration stage. This is expected because the neutrino luminosity is dominated by these neutrinos and reaches 1.1 × 1049 erg/s for delayed-detonation and 6.4 × 1049 for pure deflagration. Finally, the time delay between the two emission maxima of a delayed-detonation SN and their relative length will be very important aspects of the data analysis.
3.1.1. Neutrino background and signal-to-noise ratio
Additional comments on the expected background signals are due. For a νe emission and supernova at larger (>10 kpc) distance, we face a problem of the background emission from 8B, 7Be and CNO solar neutrinos (left panel in Fig. 8). Here a directional detection could be a solution, but no practical method of this kind exists. Electron antineutrino emission will be blended with the geoneutrinos (Fig. 8, right) and the terrestrial nuclear power plants. The geoneutrino flux varies slightly across the continental crust and is much lower on the ocean floor (Learned et al. 2006; Araki et al. 2005; BOREXINO Collaboration et al. 2010). Flux from human-made sources strongly depends on the location of the detector and varies in time (Lasserre & Sobel 2005). Other sources of neutrinos, e.g. from cosmological core-collapse supernovae8 (flux ≪ 10 cm-2 s-1, Lien et al. 2010; Totani & Sato 1995; dot-dashed curve in the right panel of Fig. 8) are far below the expected signal from a galactic SN Ia. Relic neutrino flux is on the order of 56 c ≃ 1 × 1012 cm-2 s-1, but the energy is very small in this case (~10-4 eV).
From Fig. 8 it is clear that the neutrinos from a galactic SN Ia could be detected, especially for the pure deflagration event. Neutrino observations of such a supernova are mainly a technological challenge (requires a very large detector mass, new detection techniques, low-energy threshold, etc.) and, similar to SN 1987A, a matter of chance. Cappellaro et al. (1997) estimated 4 ± 1 type Ia supernovae per millennium for Galaxy. An Earth-centered ball with the radius of 10 kpc (1 kpc) contains ≈50% (≈0.5%) of stars (Bahcall & Soneira 1980), and the corresponding SN Ia explosion probability within a period of 10 years is therefore ≈0.02 (≈2 × 10⁻⁴).
4. Conclusions
We have obtained and analyzed neutrino light curves and neutrino spectra for two models of the most popular type Ia supernova explosion scenarios: a pure deflagration and a delayed detonation. We discussed the role of physical conditions in producing neutrinos in these types of explosions. In particular, the neutrino emission studies allow us to directly probe the density, temperature, and composition of the neutrino-emitting matter. This motivates the development of neutrino experiments for exploring stellar evolution physics beyond core-collapse supernova and solar applications.
Because of their cosmological importance and because their exact origins remain unknown, thermonuclear supernovae are a class of exciting future targets of the neutrino astronomy. The upcoming challenge is a detection of the SN Ia neutrinos. Several recently proposed neutrino experiments will offer a sensitivity that will allow detecting a thermonuclear event at kpc distances. More importantly, we find the that the next generation of neutrino detectors will be able to unambiguously identify the mechanism responsible for the explosion. In particular, SN Ia supernova electron neutrinos probe the thermonuclear deflagration stage, while the electron antineutrinos probe the detonation phase. Because the electron neutrinos stem almost exclusively from electron captures associated with the thermonuclear flame, they offer a means to study both nuclear and combustion physics under extreme conditions. On the other hand, the delayed electron antineutrino signal provides direct evidence for thermonuclear detonation. Finally, the muon neutrinos are exclusively produced in thermal processes and could potentially be used to extract weak nuclear signals.
Given a relatively low neutrino luminosity of SN Ia events that are caused by delayed detonations, their characteristic double-peaked neutrino light curves can be used to reduce the false-alarm rate and serve as an early warning system for this type of events. A pure deflagration SN Ia produces only a single neutrino emission maximum with a somewhat faster rise time compared to a delayed detonation. The predicted number of observed neutrino events is, however, higher for deflagrations thanks to both a higher neutrino luminosity and slightly higher energies of the emitted neutrinos. For a 0.5 Mt classical water Cherenkov detector (LBNE WC, long baseline neutrino experiment Scholberg 2010; Memphys, Autiero et al. 2007; Rubbia 2009), we predict the recording about 20 elastic scattering events above 4 MeV per second for a SN Ia event located at a distance of 1 kiloparsec. Still larger detectors (e.g. Titan-D Suzuki 2001, 2008; Kistler et al. 2008) almost certainly guarantee positive detection of a galactic SN Ia. However, this holds true only for a pure deflagration; the predicted neutrino fluxes for a delayed detonation are about five times lower which makes these events much harder to detect. We also found that the neutrino emission is very similar to two-dimensional axisymmetric and spherically symmetric pure deflagration models (i.e. W7 by Nomoto et al. 1984). This leads us to believe that the neutrino observations will not help to distinguish between specific scenarios of pure deflagrations (e.g. ignition occurring at a single point or at multiple points).
The majority of neutrino experiments considered here (detectors IBD2, ES0, and PES in Table 2) use large amounts of a liquid scintillator. This type of experiments might be the most viable and successful in detecting type Ia supernovae, especially if a proton elastic scattering (PES) method is used (Beacom et al. 2002). One example of such a device is the Borexino detector (Alimonti et al. 2009). Although it is perhaps too small for detecting a thermonuclear supernova at a kpc distance, Borexino will be an essential testbed for the proposed and much larger LENA (Autiero et al. 2007; Marrodán-Undagoitia et al. 2006; Oberauer et al. 2005) and other similar experiments (Maricic & the Hanohano collaboration 2010). We also note that neutrinos can be detected through neutrino-nucleus elastic scattering (Drukier & Stodolsky 1984; Giomataris et al. 2008; Collar 2010; Barbeau et al. 2003). However, a practical application of this technique to SN Ia may not be possible because of the prohibitively large required mass of the detector.
We conclude that a significant progress in terms of neutrino detection methods is needed for the neutrinos to become a practical tool for studying type Ia supernovae. However, a detection of a thermonuclear event at a distance of few kiloparsecs will be within the reach of the planned neutrino observatories and will offer a perfect chance to identify the mechanism that drives the explosion.
Online material
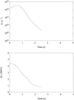 |
Fig. 9 Model neutrino (νe) particle emission in the deflagration model n7d1r10t15c (top). Average neutrino energy (bottom). |
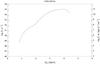 |
Fig. 10 Total νe-HR diagram for the deflagration model n7d1r10t15c. |
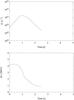 |
Fig. 11 Model antineutrino ( |
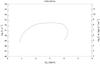 |
Fig. 12 Total |
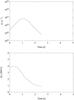 |
Fig. 13 Model muon/tau neutrino (νμ) particle emission in the deflagration model n7d1r10t15c (top). Average neutrino energy (bottom). |
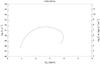 |
Fig. 14 Total νμ-HR diagram for the deflagration model n7d1r10t15c. |
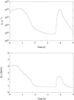 |
Fig. 15 Model neutrino (νe) particle emission in the delayed detonation model Y12 (top). Average neutrino energy (bottom). |
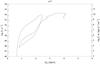 |
Fig. 16 Total νe-HR diagram for the delayed detonation model Y12. |
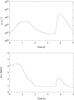 |
Fig. 17 Model antineutrino ( |
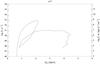 |
Fig. 18 Total |
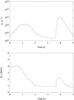 |
Fig. 19 Model muon/tau neutrino (νμ) particle emission in the delayed detonation model Y12 (top). Average neutrino energy (bottom). |
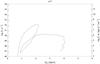 |
Fig. 20 Total νμ-HR diagram for the delayed detonation model Y12. |
In more realistic progenitor models, Ye should be slightly below 0.5 because of core burning before the explosion (Piro & Bildsten 2008) and/or variation in the initial chemical composition of the progenitor star on the main-sequence (Timmes et al. 2003).
Those regions produce neutrinos from decaying beta-unstable nuclides, e.g. 56Ni. This process does not depend on temperature.
Especially 55Co and 56Ni.
The detonation is a reactive wave in which a thin hydrodynamic shock activates a thermonuclear burn and is followed by an extended post-shock region in which the thermonuclear fuel is processed and the energy is released (Fickett & Davis 1979).
See http://ribes.if.uj.edu.pl/snIa/ for step-by-step neutrino emissivity maps, animations, digitized neutrino spectra, and additional data.
Before SN 1987A, it was not unusual to adopt a 1 kpc distance to the “future core-collapse supernova”; see, e.g., Burrows (1984).
Similar diagrams can be used to discuss other phenomena, e.g., the evolution of pre-supernovae (Odrzywolek 2007).
Those supernovae are a source of the diffuse supernova neutrino background (Horiuchi et al. 2009). The fact that the sky is
relatively dark in ,
compared to individual sources is the neutrino version of the Olbers paradox.
Acknowledgments
We thank Thomas Janka for encouragement and helpful advice, and an anonymous referee for comments that helped improving the initial version of this paper. T.P. was supported through the DOE grant DE-FG52-03NA000064. This research used resources of the National Energy Research Scientific Computing Center, which is supported by the Office of Science of the US Department of Energy under Contract No. DE-AC02-05CH11231, and NASA’s Astrophysics Data System.
References
- Ahmad, Q. R., Allen, R. C., Andersen, T. C., et al. 2001, Phys. Rev. Lett., 87, 071301 [NASA ADS] [CrossRef] [PubMed] [Google Scholar]
- Alekseev, E. N., Alekseeva, L. N., Volchenko, V. I., & Krivosheina, I. V. 1987, JETP Lett., 45, 589 [NASA ADS] [Google Scholar]
- Alimonti, G., Arpesella, C., Back, H., et al. 2009, Nuclear Instruments and Methods in Physics Research Section A: Accelerators, Spectrometers, Detectors and Associated Equipment, 600, 568 [Google Scholar]
- Ando, S., Beacom, J. F., & Yüksel, H. 2005, Phys. Rev. Lett., 95, 171101 [NASA ADS] [CrossRef] [PubMed] [Google Scholar]
- Araki, T., Enomoto, S., Furuno, K., et al. 2005, Nature, 436, 499 [NASA ADS] [CrossRef] [PubMed] [Google Scholar]
- Arcones, A., Martínez-Pinedo, G., Roberts, L. F., & Woosley, S. E. 2010, A&A, 522, A25 [NASA ADS] [CrossRef] [EDP Sciences] [Google Scholar]
- Arnett, D. 1996, Supernovae and Nucleosynthesis (Princeton: Princeton University Press) [Google Scholar]
- Arnett, W. D., Bahcall, J. N., Kirshner, R. P., & Woosley, S. E. 1989, ARA&A, 27, 629 [NASA ADS] [CrossRef] [Google Scholar]
- Arpesella, C., Back, H. O., Balata, M., et al. 2008, Phys. Rev. Lett., 101, 091302 [NASA ADS] [CrossRef] [PubMed] [Google Scholar]
- Aufderheide, M. B., Fushiki, I., Fuller, G. M., & Weaver, T. A. 1994a, ApJ, 424, 257 [NASA ADS] [CrossRef] [Google Scholar]
- Aufderheide, M. B., Fushiki, I., Woosley, S. E., & Hartmann, D. H. 1994b, ApJS, 91, 389 [NASA ADS] [CrossRef] [Google Scholar]
- Autiero, D., Äystö, J., Badertscher, A., et al. 2007, J. Cosmol. Astro-Part. Phys., 11, 11 [Google Scholar]
- Badenes, C., Hughes, J. P., Bravo, E., & Langer, N. 2007, ApJ, 662, 472 [NASA ADS] [CrossRef] [Google Scholar]
- Bahcall, J. N. 1989, Neutrino Astrophysics (Cambridge: Cambridge University Press) [Google Scholar]
- Bahcall, J. N., & Soneira, R. M. 1980, ApJS, 44, 73 [NASA ADS] [CrossRef] [Google Scholar]
- Bahcall, J. N., Serenelli, A. M., & Basu, S. 2005, ApJ, 621, L85 [NASA ADS] [CrossRef] [Google Scholar]
- Barbeau, P. S., Collar, J. I., Miyamoto, J., & Shipsey, J. 2003, IEEE Trans. Nucl. Sci., 50, 1285 [NASA ADS] [CrossRef] [Google Scholar]
- Beacom, J. F., & Vagins, M. R. 2004, Phys. Rev. Lett., 93, 171101 [NASA ADS] [CrossRef] [PubMed] [Google Scholar]
- Beacom, J. F., Farr, W. M., & Vogel, P. 2002, Phys. Rev. D, 66, 033001 [NASA ADS] [CrossRef] [Google Scholar]
- BOREXINO Collaboration, Arpesella, C., Bellini, G., et al. 2008, Phys. Lett. B, 658, 101 [NASA ADS] [CrossRef] [Google Scholar]
- BOREXINO Collaboration, Bellini, G., Benziger, J., et al. 2010, Phys. Lett. B, 687, 299 [NASA ADS] [CrossRef] [Google Scholar]
- Bowden, N. S. 2008, J. Phys. Conf. Ser., 136, 022008 [NASA ADS] [CrossRef] [Google Scholar]
- Braaten, E. 1991, Phys. Rev. Lett., 66, 1655 [NASA ADS] [CrossRef] [PubMed] [Google Scholar]
- Braaten, E., & Segel, D. 1993, Phys. Rev. D, 48, 1478 [NASA ADS] [CrossRef] [Google Scholar]
- Bruenn, S. W. 1985, ApJS, 58, 771 [NASA ADS] [CrossRef] [Google Scholar]
- Burrows, A. 1984, ApJ, 283, 848 [NASA ADS] [CrossRef] [Google Scholar]
- Burrows, A. 1990, Ann. Rev. Nucl. Part. Sci., 40, 181 [NASA ADS] [CrossRef] [Google Scholar]
- Burrows, A., & Thompson, T. A. 2002, Neutrino-Matter Interaction Rates in Supernovae: The Essential Microphysics of Core Collapse, astro-ph/0211404 [Google Scholar]
- Cappellaro, E., Turatto, M., Tsvetkov, D. Y., et al. 1997, A&A, 322, 431 [NASA ADS] [Google Scholar]
- Caurier, E., Langanke, K., Martínez-Pinedo, G., & Nowacki, F. 1999, Nuclear Physics A, 653, 439 [Google Scholar]
- Clayton, D. D. 1984, Principles of Stellar Evolution and Nucleosynthesis (Chicago: The University of Chicago Press) [Google Scholar]
- Cleveland, B. T., Daily, T., Davis, R., Jr., et al. 1998, ApJ, 496, 505 [Google Scholar]
- Clifford, F. E., & Tayler, R. F. 1965a, MNRAS, 129, 104 [NASA ADS] [Google Scholar]
- Clifford, F. E., & Tayler, R. J. 1965b, MmRAS, 69, 21 [Google Scholar]
- Collar, J. I. 2010, Collar Group, Kavli Institute for Cosmological Physics, http://collargroup.uchicago.edu/ [Google Scholar]
- Drukier, A., & Stodolsky, L. 1984, Phys. Rev. D, 30, 2295 [NASA ADS] [CrossRef] [Google Scholar]
- Dutta, S. I., Ratković, S., & Prakash, M. 2004, Phys. Rev. D, 69, 023005 [NASA ADS] [CrossRef] [Google Scholar]
- Dye, S. E. 2006, Neutrino Geophysics: Proceedings of Neutrino Sciences 2005 (Springer Verlag) [Google Scholar]
- Eguchi, K., Enomoto, S., Furuno, K., et al. 2003, Phys. Rev. Lett., 90, 021802 [NASA ADS] [CrossRef] [MathSciNet] [PubMed] [Google Scholar]
- Ellis, R. S., Sullivan, M., Nugent, P. E., et al. 2008, ApJ, 674, 51 [NASA ADS] [CrossRef] [Google Scholar]
- Enomoto, S. 2005, Ph.D. Thesis, Tohoku University [Google Scholar]
- Enomoto, S. 2006, Earth Moon and Planets, 99, 131 [NASA ADS] [CrossRef] [Google Scholar]
- Esposito, S., Mangano, G., Miele, G., Picardi, I., & Pisanti, O. 2003, Nuc. Phys. B, 658, 217 [Google Scholar]
- Fickett, W., & Davis, C. 1979, Detonation (Berkeley: University of California Press) [Google Scholar]
- Fogli, G. L., Lisi, E., Mirizzi, A., & Montanino, D. 2005a, J. Cosmol. Astro-Part. Phys., 4, 2 [NASA ADS] [CrossRef] [Google Scholar]
- Fogli, G. L., Lisi, E., Mirizzi, A., & Montanino, D. 2005b, J. Cosmol. Astro-Part. Phys., 4, 2 [NASA ADS] [CrossRef] [Google Scholar]
- Fukuda, S., Fukuda, Y., Ishitsuka, M., et al. 2001, Phys. Rev. Lett., 86, 5651 [NASA ADS] [CrossRef] [PubMed] [Google Scholar]
- Fulgione, W. 2010, J. Phys. Conf. Ser., 203, 012077 [NASA ADS] [CrossRef] [Google Scholar]
- Fuller, G. M., Fowler, W. A., & Newman, M. J. 1980, ApJS, 42, 447 [NASA ADS] [CrossRef] [Google Scholar]
- Fuller, G. M., Fowler, W. A., & Newman, M. J. 1982a, ApJ, 252, 715 [NASA ADS] [CrossRef] [Google Scholar]
- Fuller, G. M., Fowler, W. A., & Newman, M. J. 1982b, ApJS, 48, 279 [NASA ADS] [CrossRef] [Google Scholar]
- Fuller, G. M., Fowler, W. A., & Newman, M. J. 1985, ApJ, 293, 1 [NASA ADS] [CrossRef] [PubMed] [Google Scholar]
- Galeotti, P., Aglietta, M., Badino, G., et al. 1987, Helv. Phys. Acta, 60, 619 [NASA ADS] [Google Scholar]
- Gilfanov, M., & Bogdán, Á. 2010, Nature, 463, 924 [NASA ADS] [CrossRef] [PubMed] [Google Scholar]
- Giomataris, I., Irastorza, I., Savvidis, I., et al. 2008, J. Instrum., 3, P09007 [CrossRef] [Google Scholar]
- Guillian, E. H. 2006, Earth, Moon and Planets, 99, 309 [Google Scholar]
- Hachisu, I., Eriguchi, Y., & Nomaoto, K. 1986, ApJ, 308, 161 [NASA ADS] [CrossRef] [Google Scholar]
- Hampel, W., Handt, J., Heusser, G., et al. 1999, Phys. Lett. B, 447, 127 [NASA ADS] [CrossRef] [Google Scholar]
- Han, Z. 1998, MNRAS, 296, 1019 [NASA ADS] [CrossRef] [Google Scholar]
- Han, Z., & Podsiadlowski, P. 2004, MNRAS, 350, 1301 [NASA ADS] [CrossRef] [Google Scholar]
- Hirata, K., Kajita, T., Koshiba, M., Nakahata, M., & Oyama, Y. 1987, Phys. Rev. Lett., 58, 1490 [NASA ADS] [CrossRef] [PubMed] [Google Scholar]
- Höflich, P., & Stein, J. 2002, ApJ, 568, 779 [NASA ADS] [CrossRef] [Google Scholar]
- Horiuchi, S., Beacom, J. F., & Dwek, E. 2009, Phys. Rev. D, 79, 083013 [NASA ADS] [CrossRef] [Google Scholar]
- Hoyle, F., & Fowler, W. A. 1960, ApJ, 132, 565 [NASA ADS] [CrossRef] [EDP Sciences] [Google Scholar]
- Iben, Jr., I., & Tutukov, A. V. 1984, ApJS, 54, 335 [NASA ADS] [CrossRef] [Google Scholar]
- Immler, S., Weiler, K., & McCray, R. 2007, in Supernova 1987A: 20 Years After: Supernovae and Gamma-Ray Bursters, ed. S. Immler, K. Weiler, & R. McCray, Am. Inst. Phys. Conf. Ser., 937 [Google Scholar]
- Isern, J., Bravo, E., Canal, R., & Labay, J. 1993, in Nuclei in the Cosmos 2, ed. F. Kaeppeler, & K. Wisshak, 569 [Google Scholar]
- Itoh, N., Mutoh, H., Hikita, A., & Kohyama, Y. 1992, ApJ, 395, 622 [NASA ADS] [CrossRef] [Google Scholar]
- Itoh, N., Hayashi, H., Nishikawa, A., & Kohyama, Y. 1996a, ApJS, 102, 411 [NASA ADS] [CrossRef] [Google Scholar]
- Itoh, N., Nishikawa, A., & Kohyama, Y. 1996b, ApJ, 470, 1015 [NASA ADS] [CrossRef] [Google Scholar]
- Iwamoto, K., & Kunugise, T. 2006, in Origin of Matter and Evolution of Galaxies, ed. S. Kubono, W. Aoki, T. Kajino, T. Motobayashi, & K. Nomoto (New York: AIP), Am. Inst. Phys. Conf. Ser., 847, 406 [Google Scholar]
- Iwamoto, K., Brachwitz, F., Nomoto, K., et al. 1999, ApJS, 125, 439 [NASA ADS] [CrossRef] [MathSciNet] [Google Scholar]
- Juodagalvis, A., Langanke, K., Hix, W. R., Martínez-Pinedo, G., & Sampaio, J. M. 2010, Nuc. Phys. A, 848, 454 [Google Scholar]
- Kantor, E. M., & Gusakov, M. E. 2007, MNRAS, 381, 1702 [NASA ADS] [CrossRef] [Google Scholar]
- Keil, M. T., Raffelt, G. G., & Janka, H.-T. 2003, ApJ, 590, 971 [NASA ADS] [CrossRef] [Google Scholar]
- Kessler, R., Becker, A. C., Cinabro, D., et al. 2009, ApJS, 185, 32 [NASA ADS] [CrossRef] [Google Scholar]
- Khokhlov, A. M. 1989, MNRAS, 239, 785 [NASA ADS] [Google Scholar]
- Khokhlov, A. M. 1991, A&A, 245, 114 [NASA ADS] [Google Scholar]
- Khokhlov, A. M. 1995, ApJ, 449, 695 [NASA ADS] [CrossRef] [Google Scholar]
- Kiełczewska, D. 1990, Phys. Rev. D, 41, 2967 [NASA ADS] [CrossRef] [Google Scholar]
- Kistler, M. D., Yuksel, H., Ando, S., Beacom, J. F., & Suzuki, Y. 2008, [arXiv:0810.1959] [Google Scholar]
- Kohyama, Y., Itoh, N., Obama, A., & Hayashi, H. 1994, ApJ, 431, 761 [NASA ADS] [CrossRef] [Google Scholar]
- Kuhlen, M., Woosley, S. E., & Glatzmaier, G. A. 2006, ApJ, 640, 407 [NASA ADS] [CrossRef] [Google Scholar]
- Kunugise, T., & Iwamoto, K. 2007, Publications of the Astronomical Society of Japan, 59, L57 [NASA ADS] [Google Scholar]
- Kutschera, M., Odrzywołek, A., & Misiaszek, M. 2009, Acta Physica Polonica B, 40, 3063 [NASA ADS] [Google Scholar]
- Langanke, K., & Martínez-Pinedo, G. 2000, Nuc. Phys. A, 673, 481 [Google Scholar]
- Langanke, K., Martínez-Pinedo, G., & Sampaio, J. M. 2001, Phys. Rev. C, 64, 055801 [NASA ADS] [CrossRef] [Google Scholar]
- Lasserre, T., & Sobel, H. W. 2005, C. R. Phys., 6, 749 [NASA ADS] [CrossRef] [Google Scholar]
- Learned, J. G. 2004, White paper on Gigaton Array, www.phys.hawaii.edu/~jgl/post/gigaton_array.eps [Google Scholar]
- Learned, J. G. 2005, Nuc. Phys. B – Proc. Suppl., 143, 152 [NASA ADS] [CrossRef] [Google Scholar]
- Learned, J. G., Dye, S. T., & Pakvasa, S. 2006, Earth Moon and Planets, 99, 1 [NASA ADS] [CrossRef] [Google Scholar]
- Leonard, D. C. 2009, Seeking Core-Collapse Supernova Progenitors in Pre-Explosion Images [arXiv:0908.1812v1] [Google Scholar]
- Lhuillier, D. 2009, Nuc. Phys. B – Proc. Suppl., 188, 112, Proceedings of the Neutrino Oscillation Workshop [Google Scholar]
- Lien, A., Fields, B. D., & Beacom, J. F. 2010, Phys. Rev. D, 81, 083001 [NASA ADS] [CrossRef] [Google Scholar]
- Maricic, J., & the Hanohano collaboration. 2010, J. Phys. Conf. Ser., 203, 012137 [Google Scholar]
- Marrodán-Undagoitia, T., von Feilitzsch, F., Goeger-Neff, M., et al. 2006, Progress in Particle and Nuclear Physics, 57, 283, International Workshop of Nuclear Physics 27th course – Neutrinos in Cosmology, in Astro, Particle and Nuclear Physics [NASA ADS] [CrossRef] [Google Scholar]
- Meng, X., & Yang, W. 2010, ApJ, 710, 1310 [NASA ADS] [CrossRef] [Google Scholar]
- Misiaszek, M., Odrzywolek, A., & Kutschera, M. 2006, Phys. Rev. D, 74, 043006 [NASA ADS] [CrossRef] [Google Scholar]
- Munakata, H., Kohyama, Y., & Itoh, N. 1985, ApJ, 296, 197 [NASA ADS] [CrossRef] [Google Scholar]
- Nabi, J., & Klapdor-Kleingrothaus, H. V. 1999, Atomic Data and Nuclear Data Tables, 71, 149 [Google Scholar]
- Nabi, J.-U., & Sajjad, M. 2008, Phys. Rev. C, 77, 055802 [NASA ADS] [CrossRef] [Google Scholar]
- Nakahata, M. 2007, Super-Kamiokande, http://sn1987a-20th.physics.uci.edu/0830-Nakahata.eps [Google Scholar]
- Nakahata, M., & Sobel, H. 2007, Twenty Years after SN1987A, What did we learn, what will the next Supernova teach us?, http://sn1987a-20th.physics.uci.edu/ [Google Scholar]
- Nomoto, K., Sugimoto, D., & Neo, S. 1976, Ap&SS, 39, L37 [NASA ADS] [CrossRef] [Google Scholar]
- Nomoto, K., Thielemann, F.-K., & Yokoi, K. 1984, ApJ, 286, 644 [Google Scholar]
- Nomoto, K., Iwamoto, K., Tsujimoto, T., & Hashimoto, M. 1993, in Frontiers of Neutrino Astrophysics, ed. Y. Suzuki, & K. Nakamura (Tokyo: Universal Academy Press), 235 [Google Scholar]
- Nomoto, K., Iwamoto, K., Nakasato, N., et al. 1997, Nuc. Phys. A, 621, 467 [NASA ADS] [CrossRef] [Google Scholar]
- Oberauer, L., von Feilitzsch, F., & Potzel, W. 2005, Nuc. Phys. B – Proc. Suppl., 138, 108, Proceedings of the Eighth International Workshop on Topics in Astroparticle and Undeground Physics [NASA ADS] [CrossRef] [Google Scholar]
- Oda, T., Hino, M., Muto, K., Takahara, M., & Sato, K. 1994, Atomic Data and Nuclear Data Tables, 56, 231 [Google Scholar]
- Odrzywolek, A. 2005–2010, PSNS code http://th-www.if.uj.edu.pl/psns/ [Google Scholar]
- Odrzywołek, A. 2007, Eur. Phys. J. C, 52, 425 [NASA ADS] [CrossRef] [EDP Sciences] [Google Scholar]
- Odrzywolek, A. 2007, Silicon burning neutrinos, http://sn1987a-20th.physics.uci.edu/1630-Odrzywolek.eps [Google Scholar]
- Odrzywolek, A. 2009, Phys. Rev. C, 80, 045801 [NASA ADS] [CrossRef] [Google Scholar]
- Pakmor, R., Kromer, M., Röpke, F. K., et al. 2010, Nature, 463, 61 [NASA ADS] [CrossRef] [PubMed] [Google Scholar]
- Phillips, M. M. 2005, in Supernovae as Cosmological Lighthouses, ed. M. Turatto, S. Benetti, L. Zampieri, & W. Shea, ASP Conf. Ser., 342, 1604, 211 [Google Scholar]
- Piro, A. L. 2008, ApJ, 679, 616 [NASA ADS] [CrossRef] [Google Scholar]
- Piro, A. L., & Bildsten, L. 2008, ApJ, 673, 1009 [NASA ADS] [CrossRef] [Google Scholar]
- Plewa, T. 2007, ApJ, 657, 942 [NASA ADS] [CrossRef] [Google Scholar]
- Podsiadlowski, P. 2010, Astron. Nachr., 331, 218 [NASA ADS] [CrossRef] [Google Scholar]
- Podsiadlowski, P., Mazzali, P., Lesaffre, P., Han, Z., & Förster, F. 2008, New Astron. Rev., 52, 381 [NASA ADS] [CrossRef] [Google Scholar]
- Pons, J. A., Steiner, A. W., Prakash, M., & Lattimer, J. M. 2001, Phys. Rev. Lett., 86, 5223 [NASA ADS] [CrossRef] [PubMed] [Google Scholar]
- Raghavan, R. S. 1986, Phys. Rev. D, 34, 2088 [NASA ADS] [CrossRef] [Google Scholar]
- Raskin, C., Scannapieco, E., Rhoads, J., & Della Valle, M. 2009, ApJ, 707, 74 [NASA ADS] [CrossRef] [Google Scholar]
- Riess, A. G., Filippenko, A. V., Challis, P., et al. 1998, AJ, 116, 1009 [NASA ADS] [CrossRef] [Google Scholar]
- Riess, A. G., Macri, L., Casertano, S., et al. 2009, ApJ, 699, 539 [NASA ADS] [CrossRef] [Google Scholar]
- Rubbia, A. 2009, J. Phys. Conf. Ser., 171, 012020 [Google Scholar]
- Ruiter, A. J., Belczynski, K., & Fryer, C. 2009, ApJ, 699, 2026 [NASA ADS] [CrossRef] [Google Scholar]
- Ruiz-Lapuente, P., Comeron, F., Méndez, J., et al. 2004, Nature, 431, 1069 [NASA ADS] [CrossRef] [PubMed] [Google Scholar]
- Saio, H., & Nomoto, K. 1985, A&A, 150, L21 [NASA ADS] [Google Scholar]
- Sandage, A., & Tammann, G. A. 1993, ApJ, 415, 1 [NASA ADS] [CrossRef] [Google Scholar]
- Scannapieco, E., & Bildsten, L. 2005, ApJ, 629, L85 [NASA ADS] [CrossRef] [Google Scholar]
- Schawinski, K. 2009, MNRAS, 397, 717 [NASA ADS] [CrossRef] [Google Scholar]
- Schinder, P. J., Schramm, D. N., Wiita, P. J., Margolis, S. H., & Tubbs, D. L. 1987, ApJ, 313, 531 [NASA ADS] [CrossRef] [Google Scholar]
- Scholberg, K. 2010, J. Phys. Conf. Ser., 203, 012079 [NASA ADS] [CrossRef] [Google Scholar]
- Seitenzahl, I. R., Townsley, D. M., Peng, F., & Truran, J. W. 2009, Atomic Data and Nuclear Data Tables, 95, 96 [Google Scholar]
- Smartt, S. J. 2009, ARA&A, 47, 63 [NASA ADS] [CrossRef] [Google Scholar]
- Smirnov, A. 2009, Workshop Towards Neutrino Technologies, http://cdsagenda5.ictp.trieste.it/full_display.php?ida=a08170 [Google Scholar]
- Suzuki, Y. 2001, [arXiv:0110005] [Google Scholar]
- Suzuki, Y. 2008, J. Phys. Conf. Ser., 136, 022057 [NASA ADS] [CrossRef] [Google Scholar]
- Thielemann, F.-K. 1984, Adv. Space Res., 4, 67 [NASA ADS] [CrossRef] [PubMed] [Google Scholar]
- Timmes, F. X., Brown, E. F., & Truran, J. W. 2003, ApJ, 590, L83 [NASA ADS] [CrossRef] [Google Scholar]
- Totani, T., & Sato, K. 1995, Astrop. Phys., 3, 367 [NASA ADS] [CrossRef] [Google Scholar]
- Van Der Velde, J. C., Haines, Todd, Bratton, C. B., et al. 1988, Nucl. Instrum. Meth. A, 264, 28 [NASA ADS] [CrossRef] [Google Scholar]
- Wang, B., Li, X., & Han, Z. 2010, MNRAS, 401, 2729 [NASA ADS] [CrossRef] [Google Scholar]
- Webbink, R. F. 1984, ApJ, 277, 355 [NASA ADS] [CrossRef] [Google Scholar]
- Whelan, J., & Iben, Jr., I. 1973, ApJ, 186, 1007 [NASA ADS] [CrossRef] [Google Scholar]
- Wood-Vasey, W. M., Miknaitis, G., Stubbs, C. W., et al. 2007, ApJ, 666, 694 [NASA ADS] [CrossRef] [Google Scholar]
- Woosley, S. E., & Weaver, T. A. 1994, in Supernovae, ed. S. A. Bludman, R. Mochkovitch, & J. Zinn-Justin, 63, given at Les Houches Summer School, Session 54: Supernovae, Les Houches, France, 31 Jul.–1 Sep. 1990 [Google Scholar]
- Yakovlev, D. G., Kaminker, A. D., Gnedin, O. Y., & Haensel, P. 2001, Phys. Rep., 354, 1 [NASA ADS] [CrossRef] [Google Scholar]
- Yoon, S., & Langer, N. 2003, A&A, 412, L53 [NASA ADS] [CrossRef] [EDP Sciences] [Google Scholar]
- Yoon, S., Podsiadlowski, P., & Rosswog, S. 2007, MNRAS, 380, 933 [NASA ADS] [CrossRef] [Google Scholar]
- Zingale, M., Almgren, A. S., Bell, J. B., Nonaka, A., & Woosley, S. E. 2009, ApJ, 704, 196 [NASA ADS] [CrossRef] [Google Scholar]
All Tables
Expected number of events triggered in the select proposed neutrino detectors by a thermonuclear supernova located at a distance of 1 kpc.
All Figures
|
Fig. 1 Model neutrino luminosities of the pure deflagration n7d1r10t15c. a)
Electron neutrinos,
Lνe; b)
electron anti-neutrinos, |
| In the text | |
|
Fig. 2 Maps of the neutrino emissivity in the pure deflagration model at
t = 0.5 s, i.e. near the peak of the neutrino emission; left
segment, R < 0 km νe; right
segment, R > 0 km |
| In the text | |
|
Fig. 3 Model neutrino luminosities of the delayed detonation Y12. a)
Electron neutrinos,
Lνe; b)
electron antineutrinos, |
| In the text | |
|
Fig. 4 Maps of the neutrino emissivity in the delayed-detonation model at
t = 0.8 s, i.e. near the peak of the neutrino emission produced
by the initial failed deflagration stage; left segment,
R < 0 km νe; right segment,
R > 0 km |
| In the text | |
|
Fig. 5 Maps of the neutrino emissivity in the delayed-detonation model at
t = 3.9 s, i.e. near the peak of the neutrino emission produced
by the detonation stage; left segment, R < 0 km
νe; right segment,
R > 0 km |
| In the text | |
|
Fig. 6 Neutrino-HR diagram for the n7d1r10t15c model. Every curve is a track on a Fνe− ⟨ ℰνe ⟩ plane produced by a single nucleus/ thermal process. Assuming a single parameter neutrino energy spectrum (Eq. (5)), we are able to immediately select the most interesting for further analysis processes and estimate the expected signal in a given neutrino detection channel. Particularly, we present detection of νe using elastic scattering off electrons with the threshold for detection of the electron kinetic energy of 4 MeV in a water Cherenkov detector. |
| In the text | |
|
Fig. 7 Antineutrino-HR diagram for Y12 model. Similar to Fig. 6, but now we consider a detection of
|
| In the text | |
|
Fig. 8 The νe (left) and
|
| In the text | |
|
Fig. 9 Model neutrino (νe) particle emission in the deflagration model n7d1r10t15c (top). Average neutrino energy (bottom). |
| In the text | |
|
Fig. 10 Total νe-HR diagram for the deflagration model n7d1r10t15c. |
| In the text | |
|
Fig. 11 Model antineutrino ( |
| In the text | |
|
Fig. 12 Total |
| In the text | |
|
Fig. 13 Model muon/tau neutrino (νμ) particle emission in the deflagration model n7d1r10t15c (top). Average neutrino energy (bottom). |
| In the text | |
|
Fig. 14 Total νμ-HR diagram for the deflagration model n7d1r10t15c. |
| In the text | |
|
Fig. 15 Model neutrino (νe) particle emission in the delayed detonation model Y12 (top). Average neutrino energy (bottom). |
| In the text | |
|
Fig. 16 Total νe-HR diagram for the delayed detonation model Y12. |
| In the text | |
|
Fig. 17 Model antineutrino ( |
| In the text | |
|
Fig. 18 Total |
| In the text | |
|
Fig. 19 Model muon/tau neutrino (νμ) particle emission in the delayed detonation model Y12 (top). Average neutrino energy (bottom). |
| In the text | |
|
Fig. 20 Total νμ-HR diagram for the delayed detonation model Y12. |
| In the text | |
Current usage metrics show cumulative count of Article Views (full-text article views including HTML views, PDF and ePub downloads, according to the available data) and Abstracts Views on Vision4Press platform.
Data correspond to usage on the plateform after 2015. The current usage metrics is available 48-96 hours after online publication and is updated daily on week days.
Initial download of the metrics may take a while.