Fig. 1
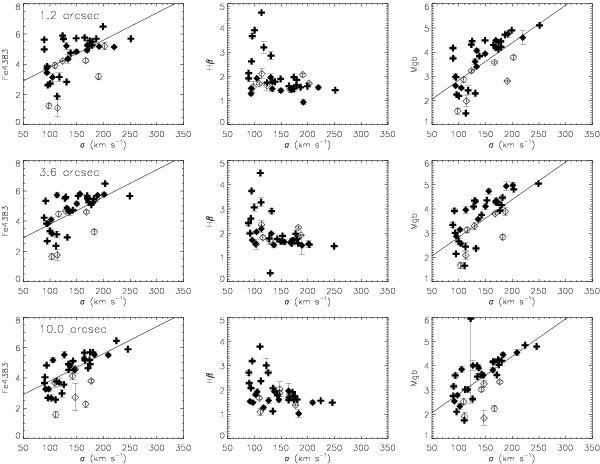
Distribution of three representative central averaged indices vs. σ for our galaxies and the Moorthy et al. galaxies: 1.2 arcsec average (top panel), averaged 3.6 arcsec (middle panel), and averaged 10.0 arcsec (bottom panel). Empty symbols represent unbarred galaxies, while filled symbols represent barred galaxies with the crosses being our galaxies and the diamonds Moorthy’s sample.

Current usage metrics show cumulative count of Article Views (full-text article views including HTML views, PDF and ePub downloads, according to the available data) and Abstracts Views on Vision4Press platform.
Data correspond to usage on the plateform after 2015. The current usage metrics is available 48-96 hours after online publication and is updated daily on week days.
Initial download of the metrics may take a while.