Free Access
Fig. 5
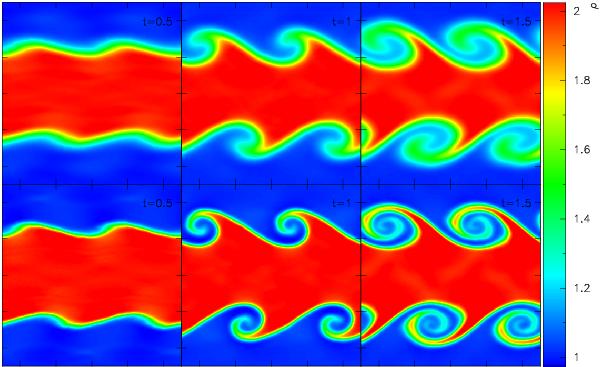
Development of the Kelvin-Helmholtz instability for the low-resolution case (top-row; 12 242 particles) and the high-resolution case (bottom-row; 98 290 particles). The plots show the evolution of the density-field (colour bar on right-hand side) at times t = 0.5, 1.0 and 1.5 (left, middle and right columns respectively).
Current usage metrics show cumulative count of Article Views (full-text article views including HTML views, PDF and ePub downloads, according to the available data) and Abstracts Views on Vision4Press platform.
Data correspond to usage on the plateform after 2015. The current usage metrics is available 48-96 hours after online publication and is updated daily on week days.
Initial download of the metrics may take a while.