Fig. 15
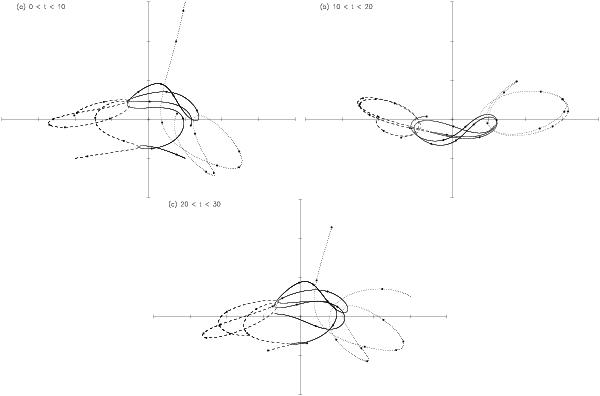
Tracks for the Burrau problem in the time intervals a) 0 < t < 10, b) 10 < t < 20, and c) 20 < t < 30. The dotted lines track star 1, the dashed lines star 2, and the solid lines star 3. Each track includes solid dots at intervals of one time unit (i.e. at t = 1, 2, 3, etc.). These tracks should be compared with those presented by Szebehely & Peters (1967, their Figs. 2–4).
Current usage metrics show cumulative count of Article Views (full-text article views including HTML views, PDF and ePub downloads, according to the available data) and Abstracts Views on Vision4Press platform.
Data correspond to usage on the plateform after 2015. The current usage metrics is available 48-96 hours after online publication and is updated daily on week days.
Initial download of the metrics may take a while.