Fig. 13
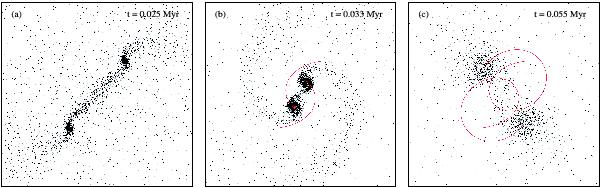
SPH and sink particle plots of Boss-Bodenheimer test at times a) t = 0.025 Myr, b) t = 0.033 Myr and c) t = 0.055 Myr. SPH particles are represented by black dots (only one in every three plotted for clarity) and the position and motion of the sink particles are represented by the red lines. The first tile (t = 0.025 Myr) shows the particle distribution just after the formation of the two sinks in the condensations that form either end of the bar. The subsequent times shows the motion of the sink particles as they move with the gas and the small disks that form around each sink. All figures show the region −0.005 < x < 0.005, −0.005 < y < 0.005.
Current usage metrics show cumulative count of Article Views (full-text article views including HTML views, PDF and ePub downloads, according to the available data) and Abstracts Views on Vision4Press platform.
Data correspond to usage on the plateform after 2015. The current usage metrics is available 48-96 hours after online publication and is updated daily on week days.
Initial download of the metrics may take a while.