Fig. 5
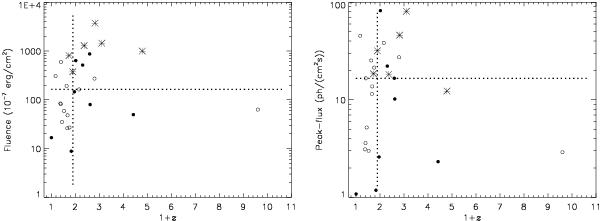
Distribution of the fluences (left panel) and peak-fluxes (right panel) of the GRBs with known redshifts, where the Fermi GRBs are denoted by asterisks, BATSE GRBs with determined redshifts (pseudo-redshifts) are denoted by dots (circles). The medians separate the area into four quadrants. The objects in the upper right quadrant are brighter and have larger redshifts than the that of GRBs in the lower left quadrant.
Current usage metrics show cumulative count of Article Views (full-text article views including HTML views, PDF and ePub downloads, according to the available data) and Abstracts Views on Vision4Press platform.
Data correspond to usage on the plateform after 2015. The current usage metrics is available 48-96 hours after online publication and is updated daily on week days.
Initial download of the metrics may take a while.