Fig. 4
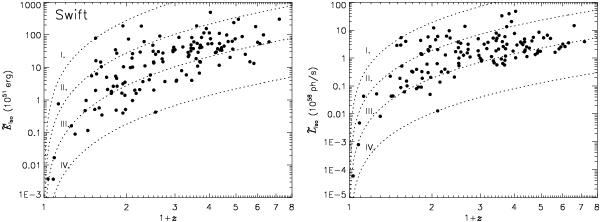
Left panel:  vs. (1 + z) (dots). Dashed contours denote constant fluences (in
units 10-7 erg/cm2): I. the maximal fluence, i.e. 1050;
II. 105; III. 10.5; IV. the minimal fluence, i.e. 0.68. Right
panel:
vs. (1 + z) (dots). Dashed contours denote constant fluences (in
units 10-7 erg/cm2): I. the maximal fluence, i.e. 1050;
II. 105; III. 10.5; IV. the minimal fluence, i.e. 0.68. Right
panel:  vs. (1 + z) (dots). Dashed contours denote constant peak-fluxes (in
units ph cm-2 s-1): I. the maximal peak-flux, i.e. 71;
II. 7.1; III. 0.71; IV. the minimal peak-flux, i.e. 0.04. The objects below a curve
at smaller redshifts together with those at higher redshifts and above the curve
illustrate the inverse behaviour.
vs. (1 + z) (dots). Dashed contours denote constant peak-fluxes (in
units ph cm-2 s-1): I. the maximal peak-flux, i.e. 71;
II. 7.1; III. 0.71; IV. the minimal peak-flux, i.e. 0.04. The objects below a curve
at smaller redshifts together with those at higher redshifts and above the curve
illustrate the inverse behaviour.
Current usage metrics show cumulative count of Article Views (full-text article views including HTML views, PDF and ePub downloads, according to the available data) and Abstracts Views on Vision4Press platform.
Data correspond to usage on the plateform after 2015. The current usage metrics is available 48-96 hours after online publication and is updated daily on week days.
Initial download of the metrics may take a while.