Fig. 8
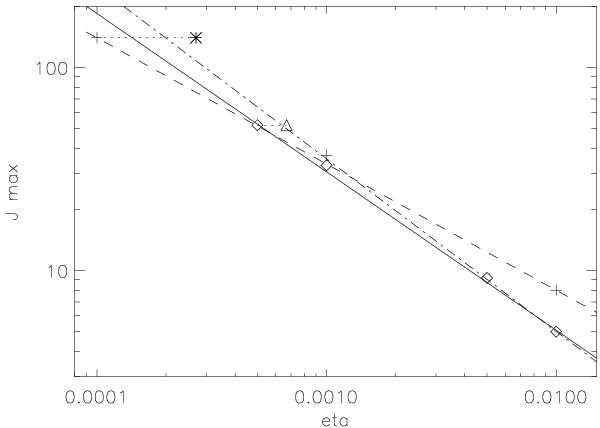
The scaling relation of the peak current with the imposed η value. The data points represent two series of experiments with different imposed driving velocities. The diamonds and the associated full line represent data with Vd = 0.05. The triangle represents the corrected η for the left most point as indicated in the previous graph, with the dot-dashed line being the correspondingly altered scaling. The crosses and the dashed line represent the data with Vd = 0.1 (with the star showing the corrected η value). The dashed line represents Eq. (3), the full line Eq. (4) and the dot-dashed line Eq. (5).
Current usage metrics show cumulative count of Article Views (full-text article views including HTML views, PDF and ePub downloads, according to the available data) and Abstracts Views on Vision4Press platform.
Data correspond to usage on the plateform after 2015. The current usage metrics is available 48-96 hours after online publication and is updated daily on week days.
Initial download of the metrics may take a while.