Fig. 12
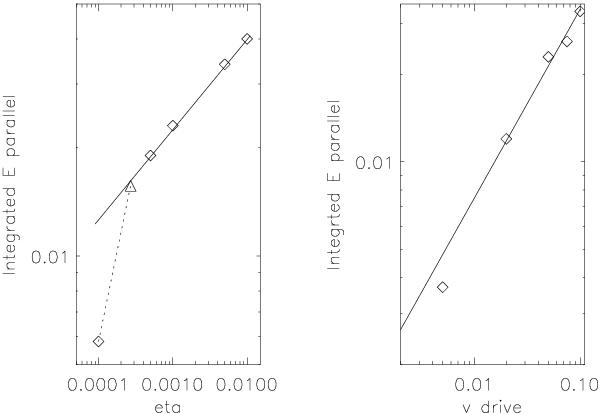
The left panel shows the dependence of the reconnection rate on the imposed η with a constant driving velocity (Vd = 0.05), with the triangle showing the corrected value for the run “C5” as discussed above, Eq. (9). The right panel shows the dependence on the reconnection rate on the imposed driving velocity, for constant η (η = 10-3), Eq. (10).
Current usage metrics show cumulative count of Article Views (full-text article views including HTML views, PDF and ePub downloads, according to the available data) and Abstracts Views on Vision4Press platform.
Data correspond to usage on the plateform after 2015. The current usage metrics is available 48-96 hours after online publication and is updated daily on week days.
Initial download of the metrics may take a while.