Fig. 19
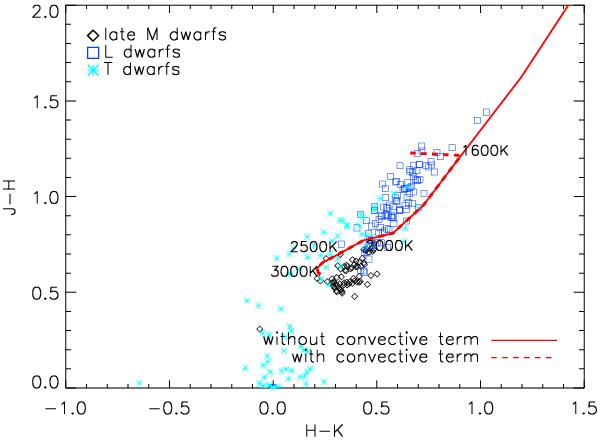
Color diagram for the 2MASS JHK filters. Late M dwarf (black diamonds), L dwarf (blue rectangles) and T dwarf (blue stars) observations are indicated. The red curve corresponds to a log (g) = 5.0 and solar abundance model sequence of the current Drift-Phoenix grid. The dotted line indicate the model color trend, if detached convection zones are considered in the grain motion.
Current usage metrics show cumulative count of Article Views (full-text article views including HTML views, PDF and ePub downloads, according to the available data) and Abstracts Views on Vision4Press platform.
Data correspond to usage on the plateform after 2015. The current usage metrics is available 48-96 hours after online publication and is updated daily on week days.
Initial download of the metrics may take a while.