Fig. 3
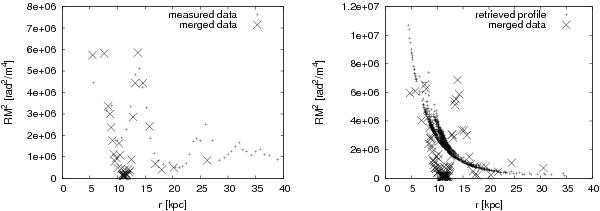
Left: radial profile of the original rotation measure data and the merged values shown in Fig. 2. To facilitate reading of the plot, the 1000 merged data points are combined within (variably sized) radial bins. Right: comparison of the merged profile with the theoretical radial profile of the ensemble average resulting from the analysis. The retrieved profile was obtained from the trace of the covariance matrix described in Eq. (18) and implicitly emerges from the modelled magnetic power spectrum shown in Fig. 8 and the assumed geometrical profiles of magnetic energy and electron density. The former determines the amplitude of the theoretical profile, whereas the latter determines the detailed radial decline. This theoretical curve was not obtained by a fit of the radial profile, which is shown here for illustration only. Instead, our inference is based on examining the cross-correlation of all pairs of points, which contain much more information compared with the autocorrelation of individual points displayed here. We note that the variations seen in the data with respect to the theoretical mean curve are a natural consequence of the data being only a single realisation of a random process, whereas the theoretical curve represents the ensemble average of a large number of these realisations.
Current usage metrics show cumulative count of Article Views (full-text article views including HTML views, PDF and ePub downloads, according to the available data) and Abstracts Views on Vision4Press platform.
Data correspond to usage on the plateform after 2015. The current usage metrics is available 48-96 hours after online publication and is updated daily on week days.
Initial download of the metrics may take a while.