Fig. 4
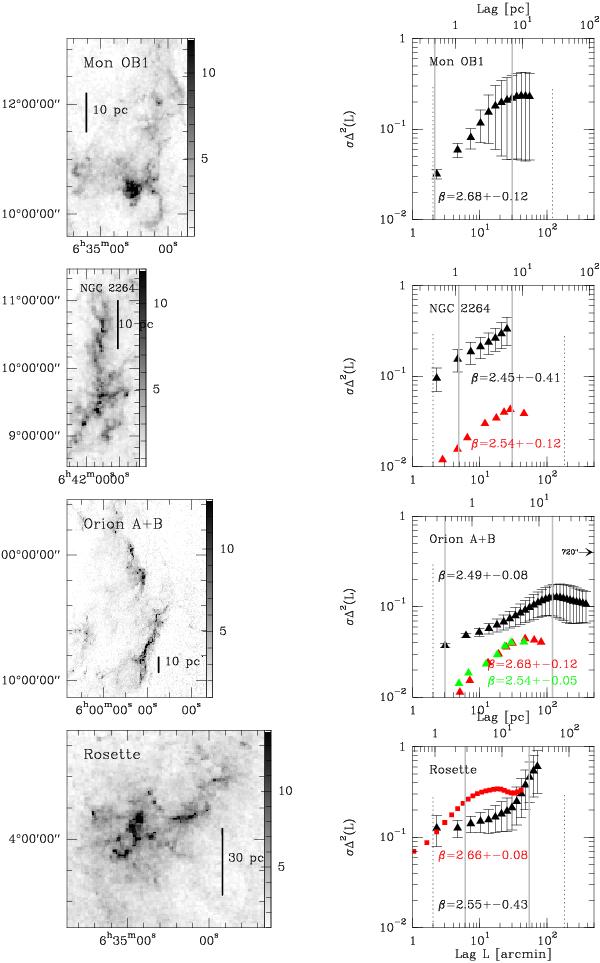
Extinction maps of Galactic molecular clouds (left) and corresponding Δ-variance (right). See Fig. 3 for further explanations. The red curves for NGC 2264 and Orion B represent 13CO 1 → 0 data from Bell Labs (see Table 1 and Bench et al. 2001). The green curve shows the spectrum for Orion A using 13CO 1 → 0 data from Bell Labs. The red curve for Rosette stems from 13CO 1 → 0 data from FCRAO (Heyer et al. 2006).
Current usage metrics show cumulative count of Article Views (full-text article views including HTML views, PDF and ePub downloads, according to the available data) and Abstracts Views on Vision4Press platform.
Data correspond to usage on the plateform after 2015. The current usage metrics is available 48-96 hours after online publication and is updated daily on week days.
Initial download of the metrics may take a while.