Fig. 5
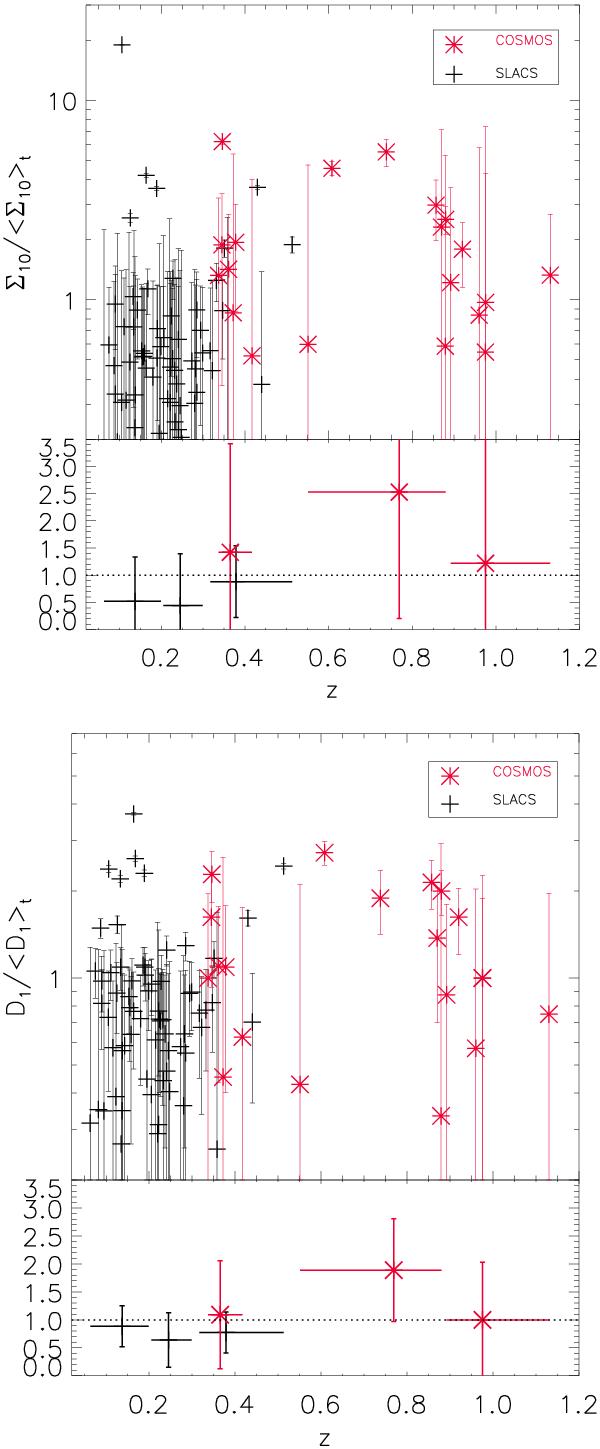
Distribution of  (top plot) and
  (bottom plot) as a function of the lens redshift for the COSMOS lenses (red stars) and the SLACS lenses (black crosses). In each plot, the lower panel displays a re-binned version of the upper plot using the the median of the ratios in different bins (SLACS bins: z < 0.2 (32 galaxies), 0.2 ≤ z < 0.3 (23 galaxies), 0.3 ≤ z < 0.5 (9 galaxies); COSMOS bins: 0.30 ≤ z < 0.42 (7 galaxies), 0.42 ≤ z < 0.89 (7 galaxies), 0.89 ≤ z < 1.30 (6 galaxies).
Current usage metrics show cumulative count of Article Views (full-text article views including HTML views, PDF and ePub downloads, according to the available data) and Abstracts Views on Vision4Press platform.
Data correspond to usage on the plateform after 2015. The current usage metrics is available 48-96 hours after online publication and is updated daily on week days.
Initial download of the metrics may take a while.