Fig. 4
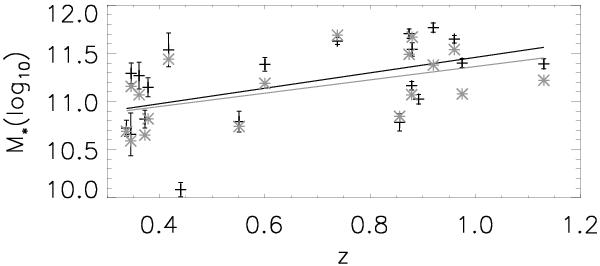
Stellar masses (in M⊙) of the lens galaxies as a function of redshift (spectroscopic when available, photometric otherwise). Black crosses: stellar masses inferred using the method described in Bundy et al. (2006). Grey stars: stellar masses inferred for the IRAC sources in Ilbert et al. (2010). Black and grey lines: the respective least-square fits, with a slope of +0.8 ± 0.3 (black line) and +0.7 ± 0.3 (grey line).
Current usage metrics show cumulative count of Article Views (full-text article views including HTML views, PDF and ePub downloads, according to the available data) and Abstracts Views on Vision4Press platform.
Data correspond to usage on the plateform after 2015. The current usage metrics is available 48-96 hours after online publication and is updated daily on week days.
Initial download of the metrics may take a while.