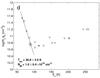
Fig. 4
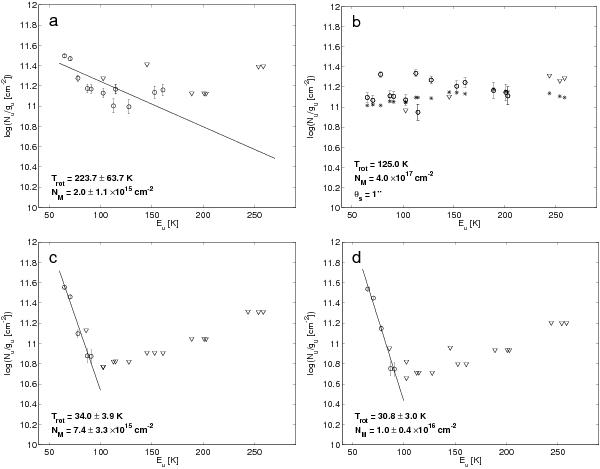
Rotation diagrams for three specific components and a population diagram for the fourth component identified in Sect. 3.2. Triangles indicate upper limits and error bars the 1σ standard deviation in the flux determination. The diagrams displayed are a) rotation diagram for the main, − 10.5 km s-1 velocity component at the “Centre” position (+3″,+3″). b) Population diagram for the redshifted, − 5.2 km s-1 velocity component at the “Centre” position (+3″,+3″); for this model asterisks indicate a best fit that includes optical depth effects and beam dilution (see Sect. 4.2), c) rotation diagram for the “NE Outflow” (+27″,+9″), d) rotation diagram for “Envelope” (+21″, − 3″).
Current usage metrics show cumulative count of Article Views (full-text article views including HTML views, PDF and ePub downloads, according to the available data) and Abstracts Views on Vision4Press platform.
Data correspond to usage on the plateform after 2015. The current usage metrics is available 48-96 hours after online publication and is updated daily on week days.
Initial download of the metrics may take a while.