Fig. 2
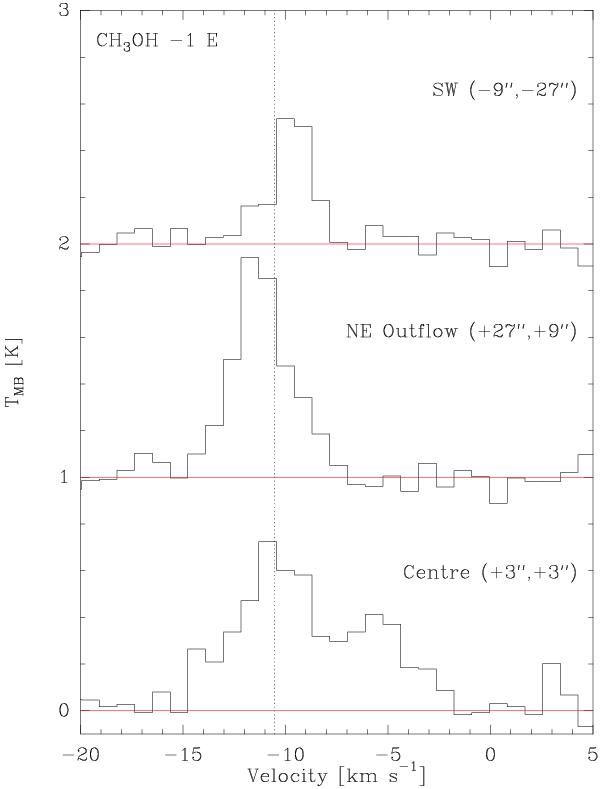
Velocity profiles of the − 1 E line at three positions. Although the profiles are Gaussian in the outflow, there is a clear shift in the velocity. At the “Centre” position there are clearly two velocity components. The dotted line is taken to be the system velocity, corresponding to the velocity of the dominant component at the “Centre” position.
Current usage metrics show cumulative count of Article Views (full-text article views including HTML views, PDF and ePub downloads, according to the available data) and Abstracts Views on Vision4Press platform.
Data correspond to usage on the plateform after 2015. The current usage metrics is available 48-96 hours after online publication and is updated daily on week days.
Initial download of the metrics may take a while.