Free Access
Fig. 1
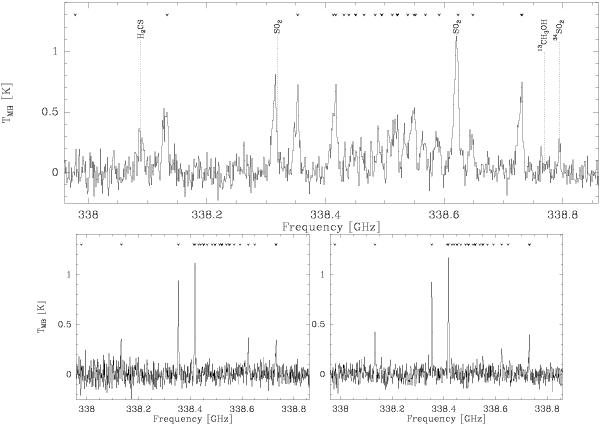
Sample spectra from the 3 positions identified in Sect. 3.2. Top spectrum at the “Centre” position, coincident with the HW2 object. Bottom Left at the position of “NE Outflow” and Bottom Right “Envelope”. The small symbols at the top indicate the frequencies of methanol transitions in this band.
This figure is made of several images, please see below:
Current usage metrics show cumulative count of Article Views (full-text article views including HTML views, PDF and ePub downloads, according to the available data) and Abstracts Views on Vision4Press platform.
Data correspond to usage on the plateform after 2015. The current usage metrics is available 48-96 hours after online publication and is updated daily on week days.
Initial download of the metrics may take a while.