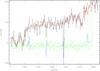
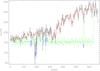
Fig. 4

Examples of spectra and pPXF fits. Top panel: the star pile spectrum in the 9–21 kpc range coming from GMOS intermediate axis longslit. Bottom panel: g3 nucleus spectrum from the FORS2 data. In both panels the original spectrum is drawn in black, while the fit is in red. Green points indicate the fit residuals, and blue portions indicate ranges that were excluded from the fit due to their large residuals from ill-subtracted sky lines or other artifacts. The wavelength range is 3900–4400 Å and 4900–5400 Å for the top and bottom panels, respectively, in the rest frame.
Current usage metrics show cumulative count of Article Views (full-text article views including HTML views, PDF and ePub downloads, according to the available data) and Abstracts Views on Vision4Press platform.
Data correspond to usage on the plateform after 2015. The current usage metrics is available 48-96 hours after online publication and is updated daily on week days.
Initial download of the metrics may take a while.