Fig. 3
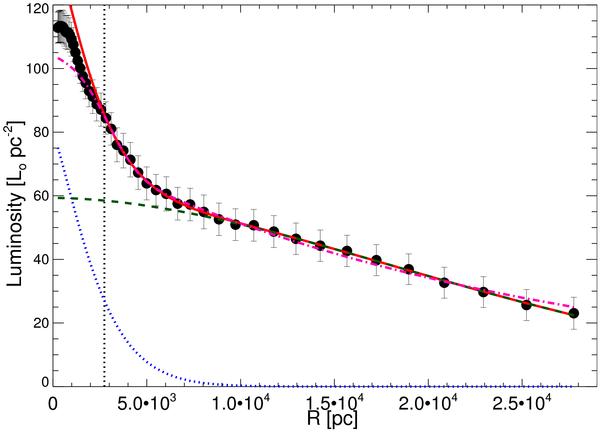
Star pile g′ luminosity profile. The blue dotted line is the Sérsic fit to the nucleus, while the green dashed line is a fit to the extended star pile. The red solid line is the sum of both. The pink dot-dashed line is the Sérsic+exponential model. The radius is the semi-major axis of the fitted ellipses. The vertical dotted line delimits the inner 1″ that was excluded from the fit.
Current usage metrics show cumulative count of Article Views (full-text article views including HTML views, PDF and ePub downloads, according to the available data) and Abstracts Views on Vision4Press platform.
Data correspond to usage on the plateform after 2015. The current usage metrics is available 48-96 hours after online publication and is updated daily on week days.
Initial download of the metrics may take a while.