Fig. 3
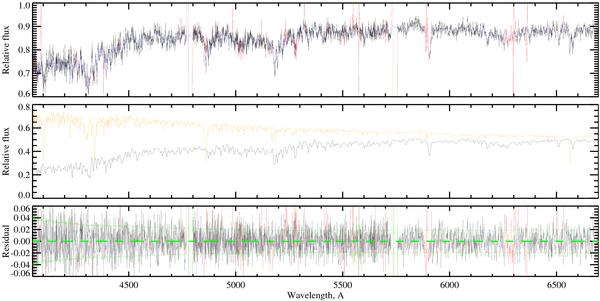
Fit of a spectrum of NGC 4486A. The top panel shows the observed (in black) and fitted (blue) spectra. The red points mark the excluded regions (because of strong telluric absorption) and the rejected pixels (kappa-sigma clipping). The two gaps between the detectors are visible near 4800 and 5750 Å. The middle panel shows the two components of the model separately, the galactic population in black, and the star in orange. The bottom panel presents the residuals (observation-model). The green lines are the 1-σ errors.
Current usage metrics show cumulative count of Article Views (full-text article views including HTML views, PDF and ePub downloads, according to the available data) and Abstracts Views on Vision4Press platform.
Data correspond to usage on the plateform after 2015. The current usage metrics is available 48-96 hours after online publication and is updated daily on week days.
Initial download of the metrics may take a while.