Free Access
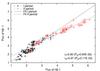
Fig. 9
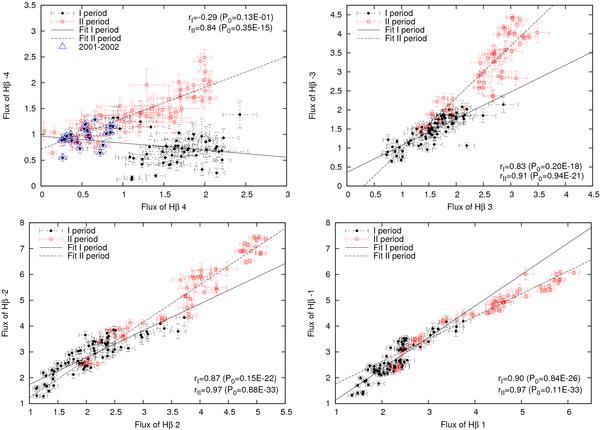
Line segment vs. line segment response. The observations in Period I are denoted with full circles and in Period II with open squares. The line-segment flux is in units 10-14 erg m-2 s-1. The Pearson correlation coefficient r and the null hypothesis value P0 are given in each plot for both periods.
This figure is made of several images, please see below:
Current usage metrics show cumulative count of Article Views (full-text article views including HTML views, PDF and ePub downloads, according to the available data) and Abstracts Views on Vision4Press platform.
Data correspond to usage on the plateform after 2015. The current usage metrics is available 48-96 hours after online publication and is updated daily on week days.
Initial download of the metrics may take a while.